
keras模型 鸾尾花数据集_聚类-鸢尾花数据集
1 花瓣长度与宽度import numpy as np%matplotlib inlineimport matplotlib.pyplot as pltfrom sklearn import datasetsiris = datasets.load_iris()X = iris.datay = iris.targetplt.scatter(X[:, 2], X[:, -1], c...
·
1 花瓣长度与宽度
import numpy as np
%matplotlib inline
import matplotlib.pyplot as plt
from sklearn import datasets
iris = datasets.load_iris()
X = iris.data
y = iris.target
plt.scatter(X[:, 2], X[:, -1], c = "red", marker='o')
plt.xlabel('petal length')
plt.ylabel('petal width')
plt.show() 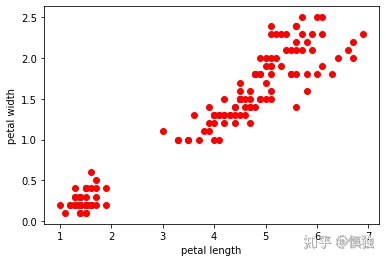
import pandas as pd
Iris=pd.DataFrame(X,columns=iris.feature_names)
Iris['species'] = y
import seaborn as sns
g = sns.PairGrid(Iris) # 成对画散点图
g.map(plt.scatter)
g = sns.PairGrid(Iris, hue="species")
g.map_diag(plt.hist)   #   对角线
g.map_offdiag(plt.scatter)  #   非对角线
g.add_legend()
#聚类后结果
from sklearn.cluster import KMeans
estimator = KMeans(n_clusters=3)
estimator.fit(X)
label_pred = estimator.labels_
x0 = X[label_pred == 0]
x1 = X[label_pred == 1]
x2 = X[label_pred == 2]
plt.scatter(x0[:, 2], x0[:, -1], c = "red", marker='o', label='label0')
plt.scatter(x1[:, 2], x1[:, -1], c = "green", marker='*', label='label1')
plt.scatter(x2[:, 2], x2[:, -1], c = "blue", marker='+', label='label2')
plt.xlabel('petal length')
plt.ylabel('petal width')
plt.legend(loc=2)
plt.show() 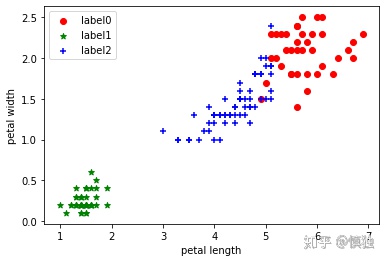
#原来数据的类别
x0 = X[y == 0]
x1 = X[y == 1]
x2 = X[y == 2]
plt.scatter(x0[:, 2], x0[:, -1], c = "red", marker='o', label='label0')
plt.scatter(x1[:, 2], x1[:, -1], c = "green", marker='*', label='label1')
plt.scatter(x2[:, 2], x2[:, -1], c = "blue", marker='+', label='label2')
plt.xlabel('petal length')
plt.ylabel('petal width')
plt.legend(loc=2)
plt.show() 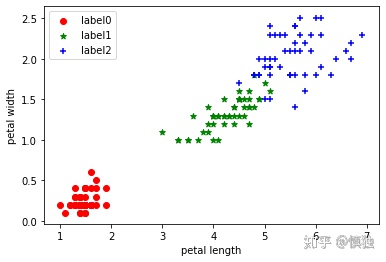
2 花萼长度与宽度
plt.scatter(X[:, 0], X[:, 1], c = "red", marker='o')
plt.xlabel('sepal length')
plt.ylabel('sepal width')
plt.show() 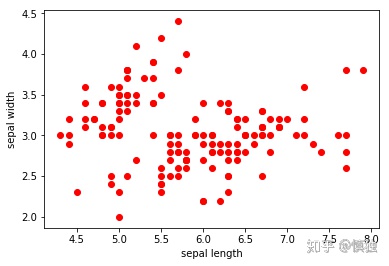
# 聚类后结果
from sklearn.cluster import KMeans
estimator = KMeans(n_clusters=3)
estimator.fit(X)
label_pred = estimator.labels_
x0 = X[label_pred == 0]
x1 = X[label_pred == 1]
x2 = X[label_pred == 2]
plt.scatter(x0[:, 0], x0[:, 1], c = "red", marker='o', label='label0')
plt.scatter(x1[:, 0], x1[:, 1], c = "green", marker='*', label='label1')
plt.scatter(x2[:, 0], x2[:, 1], c = "blue", marker='+', label='label2')
plt.xlabel('petal length')
plt.ylabel('petal width')
plt.legend(loc=2)
plt.show()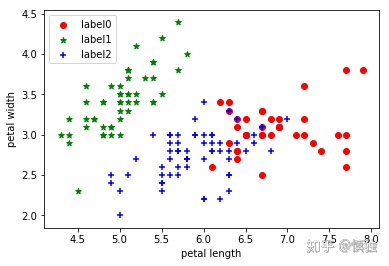
# 原来数据的类别
x0 = X[label_pred == 0]
x1 = X[label_pred == 1]
x2 = X[label_pred == 2]
plt.scatter(x0[:, 1], x0[:, 2], c = "red", marker='o', label='label0')
plt.scatter(x1[:, 1], x1[:, 2], c = "green", marker='*', label='label1')
plt.scatter(x2[:, 1], x2[:, 2], c = "blue", marker='+', label='label2')
plt.xlabel('petal length')
plt.ylabel('petal width')
plt.legend(loc=2)
plt.show() 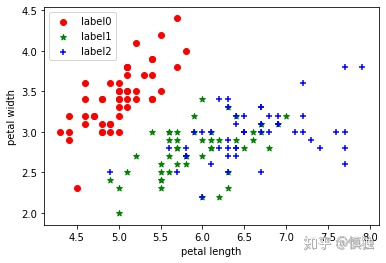

汇聚全球AI编程工具,助力开发者即刻编程。
更多推荐


 0
0 0
0- 0


 已为社区贡献1条内容

所有评论(0)