
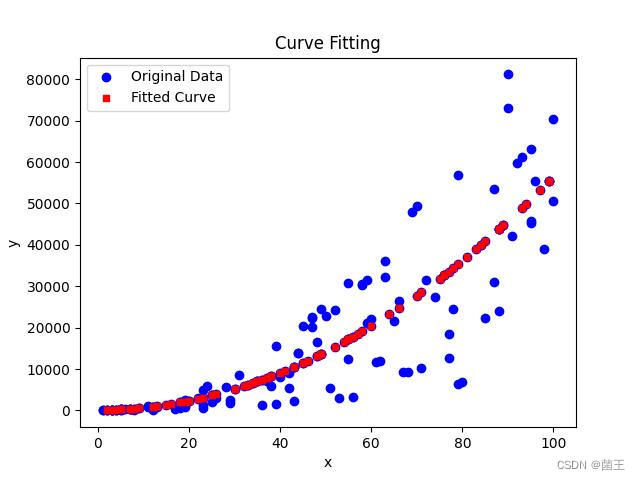
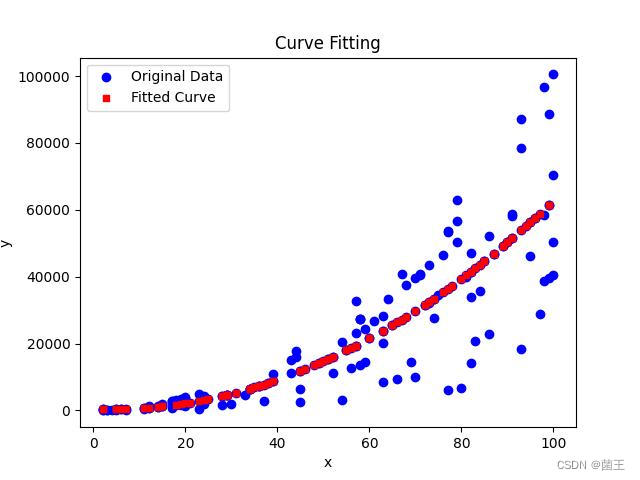
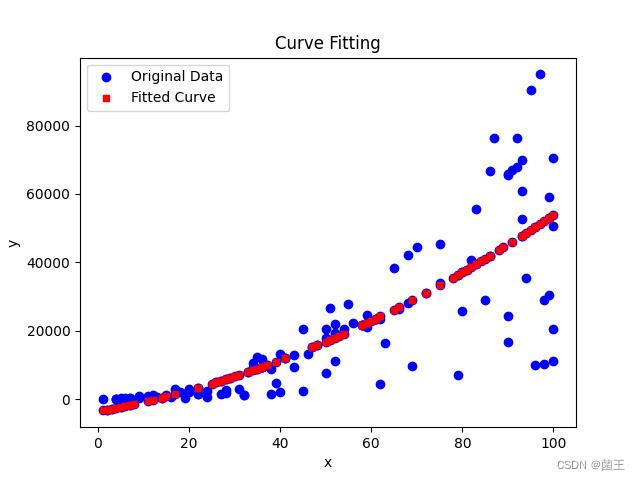
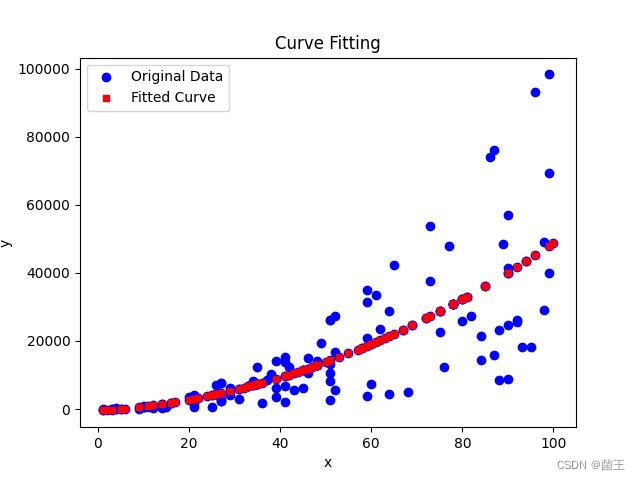
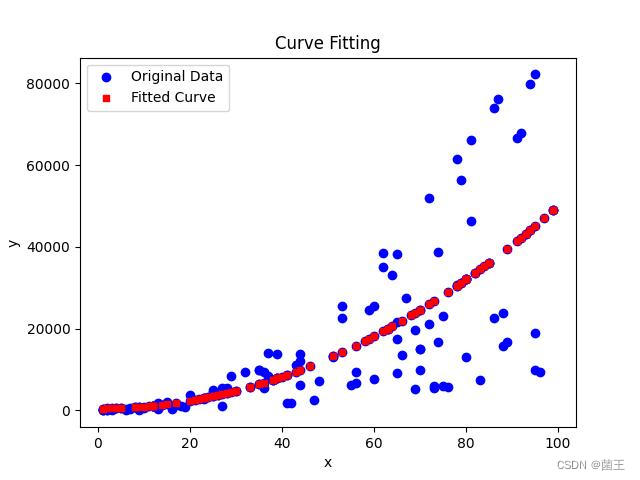
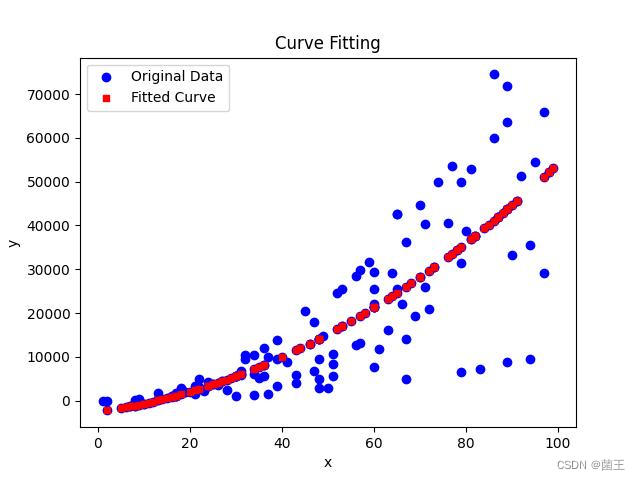
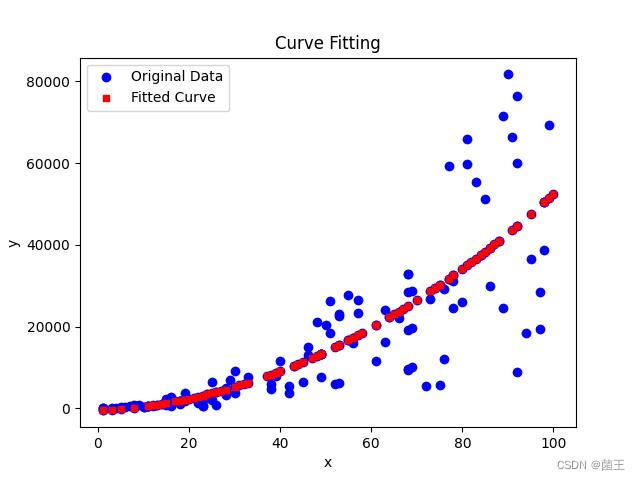
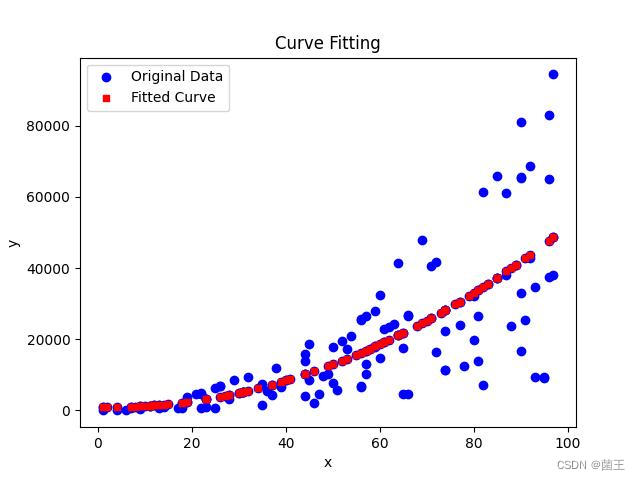
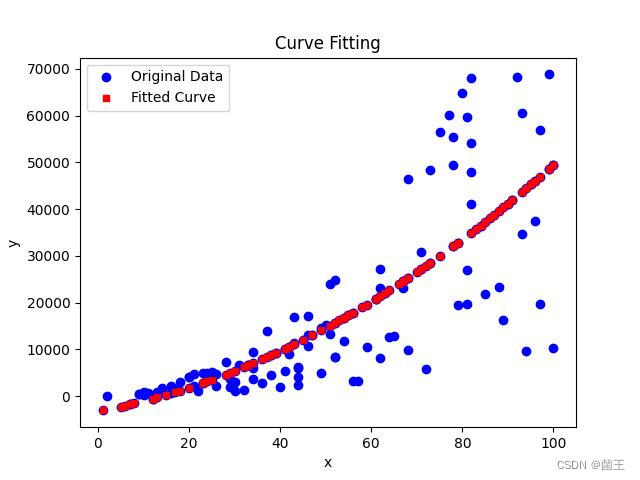
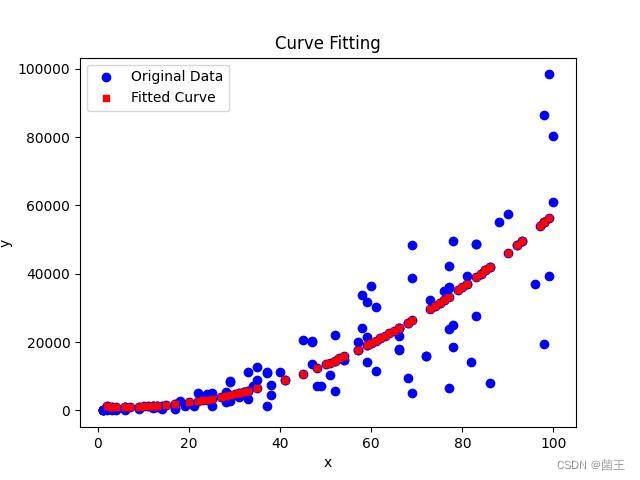
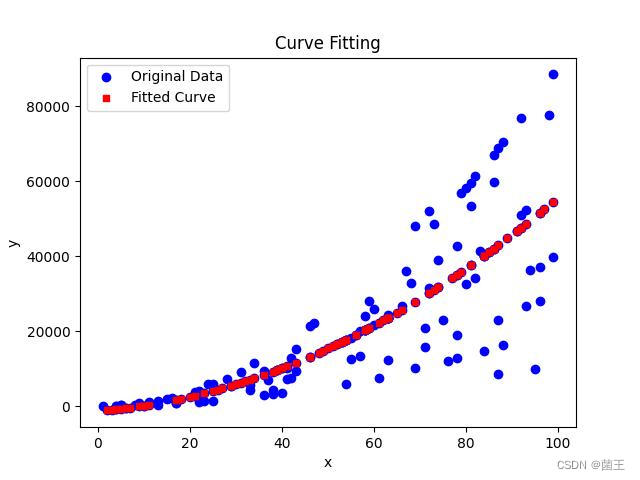
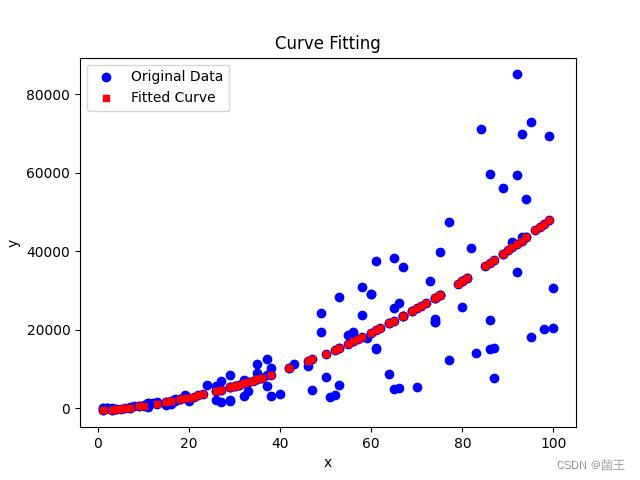
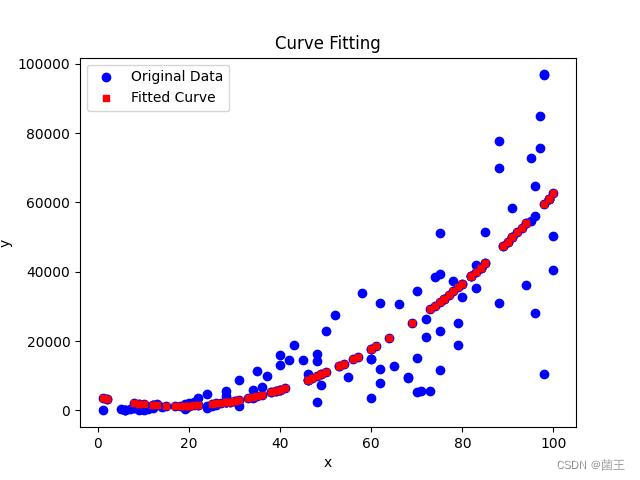
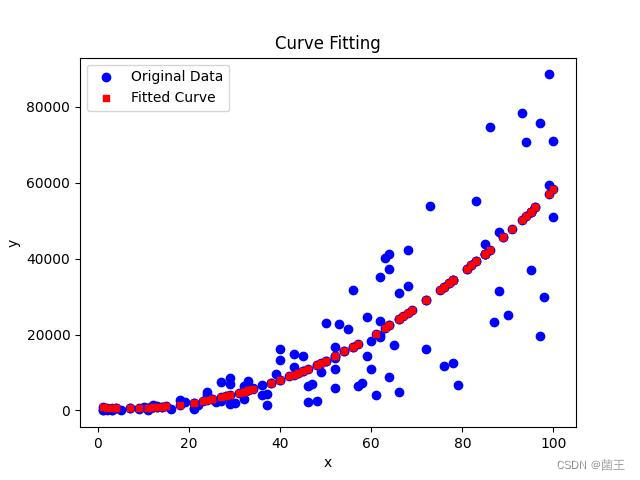
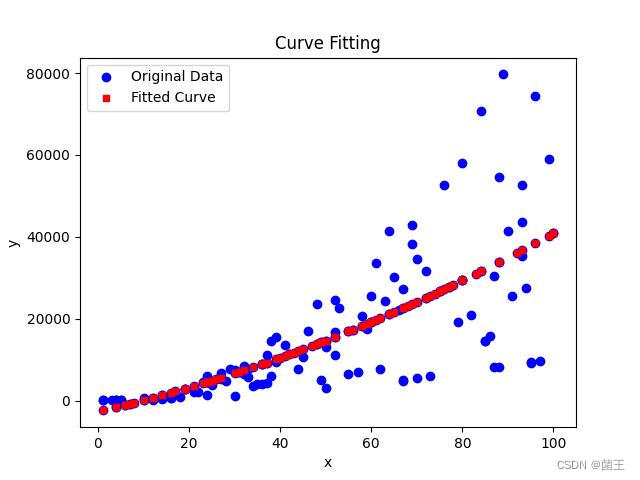
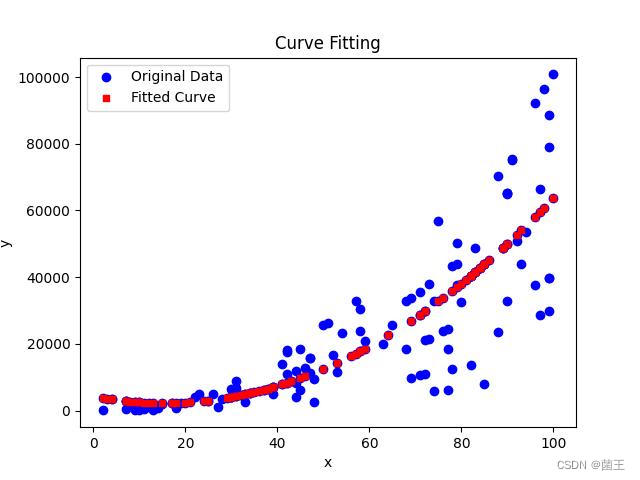
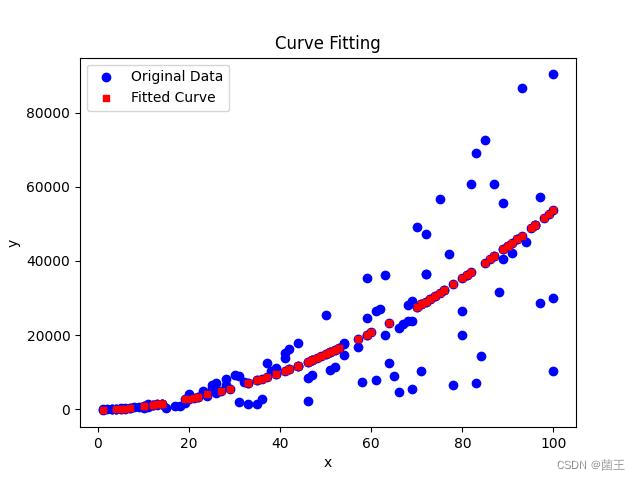
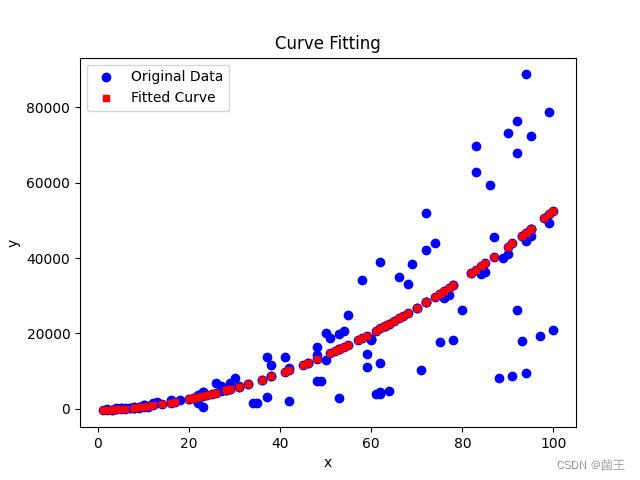
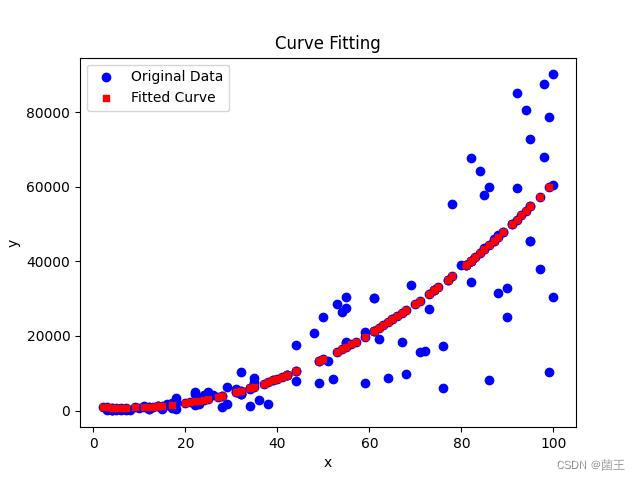
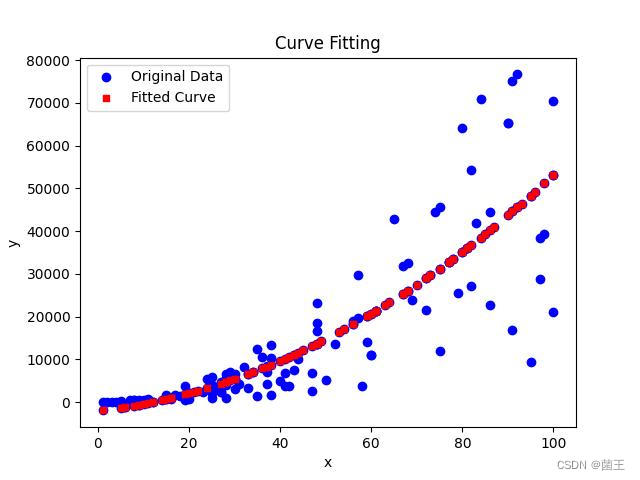
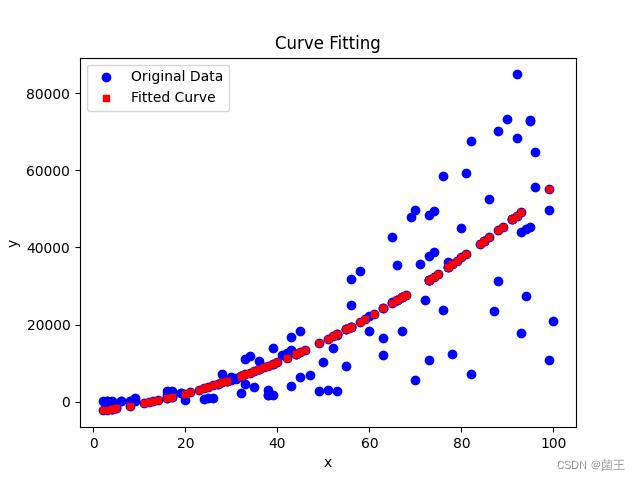
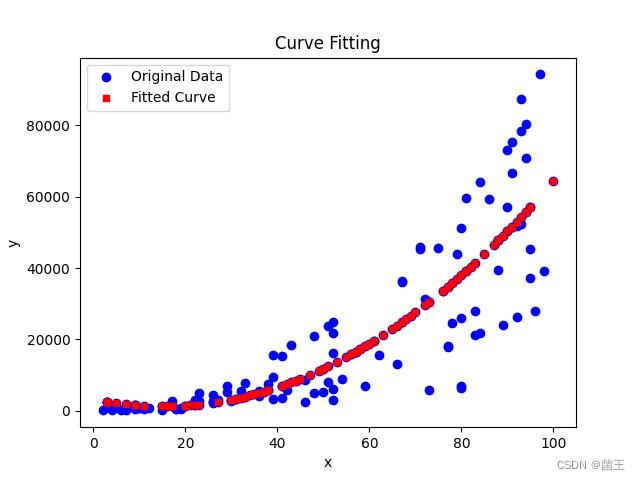
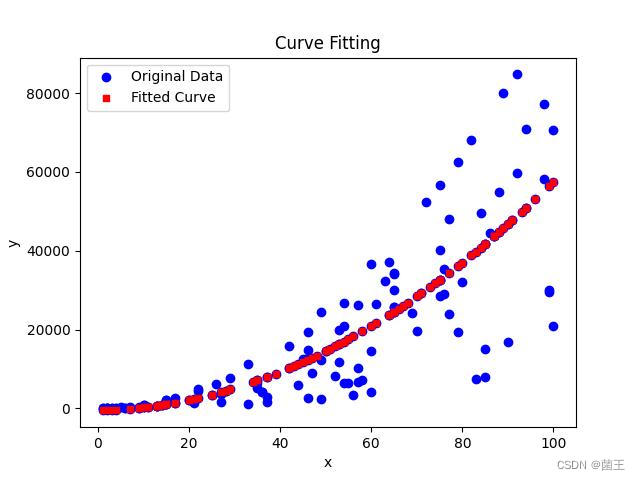
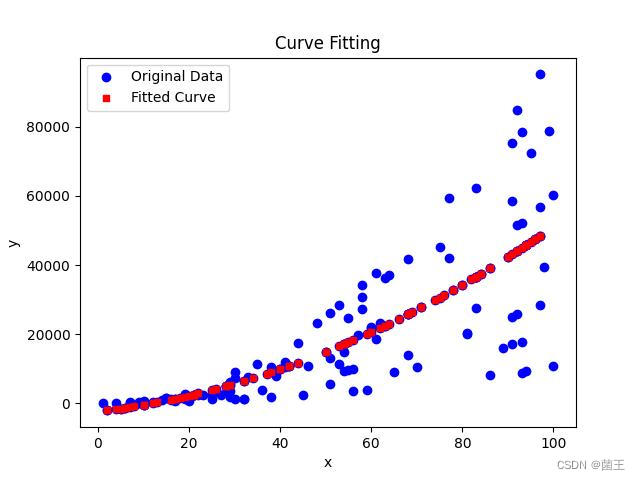
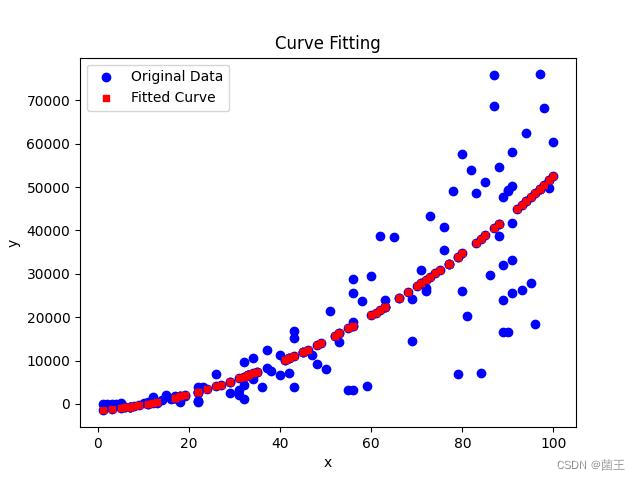
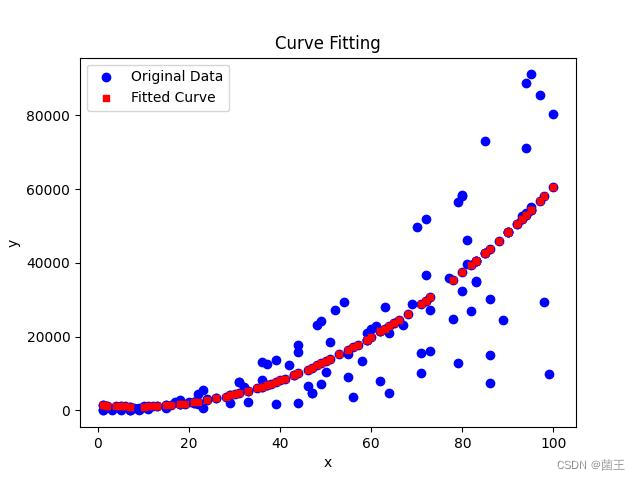
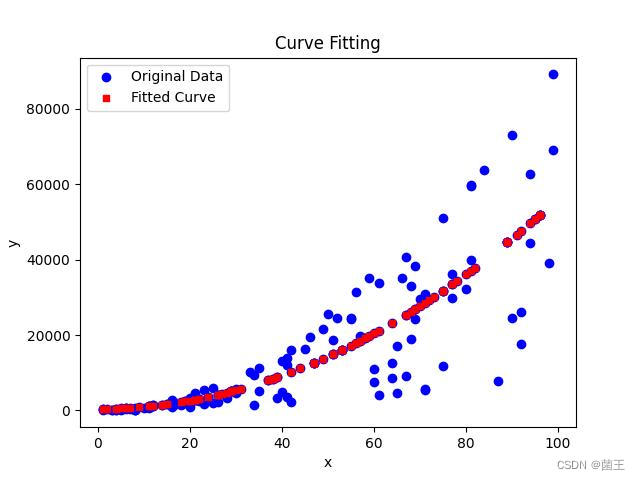
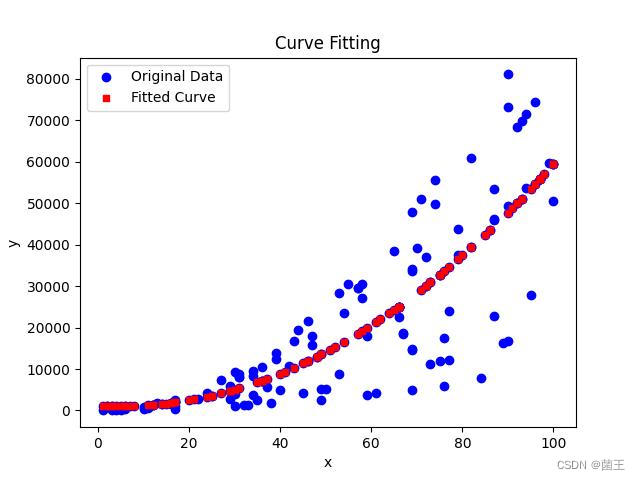
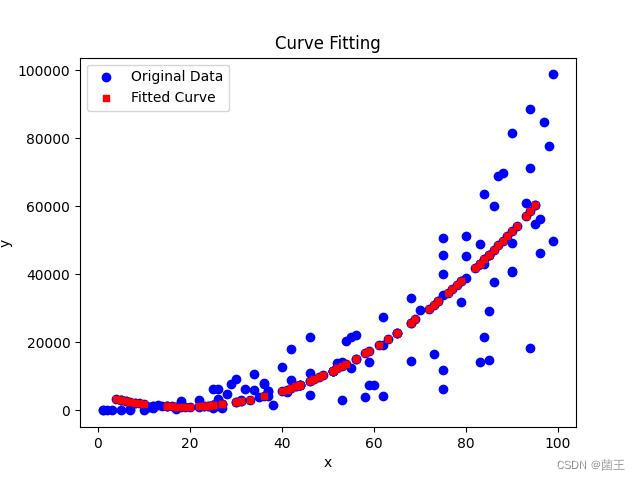
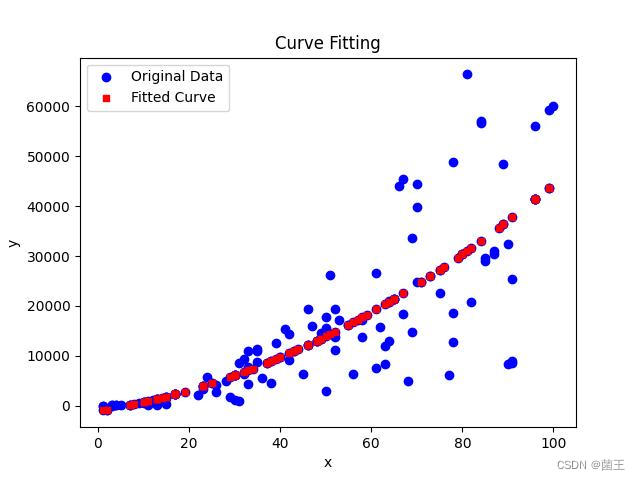
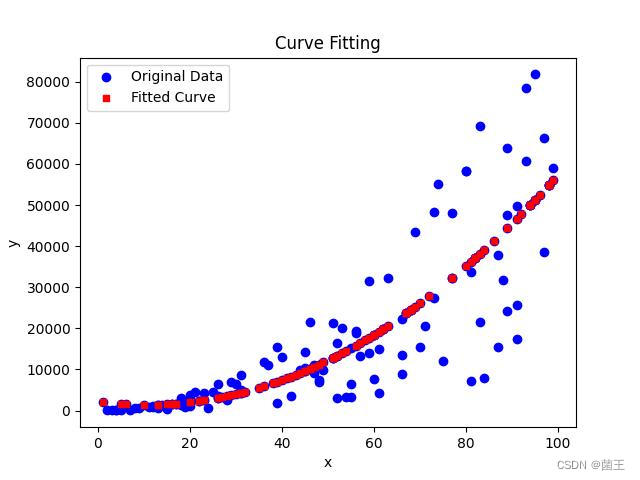
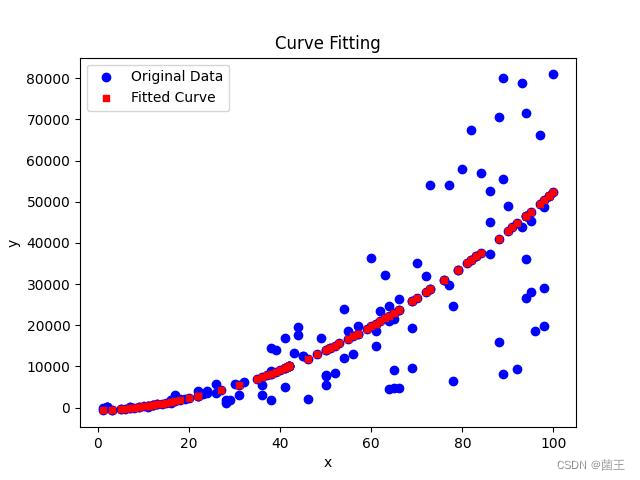
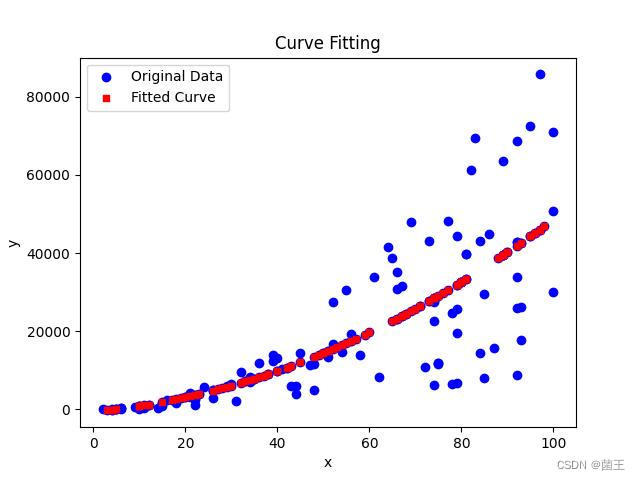
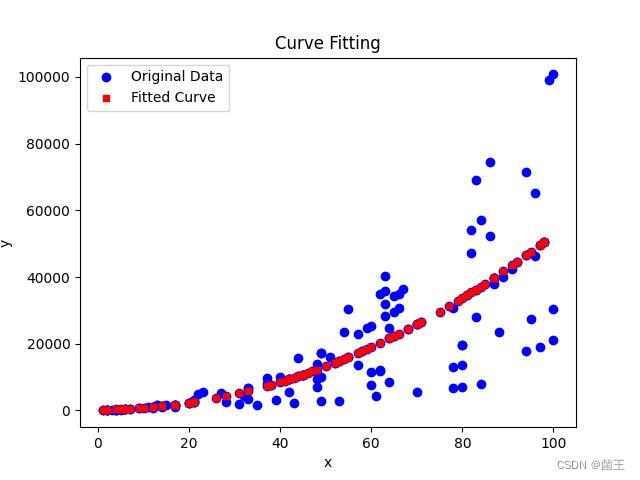
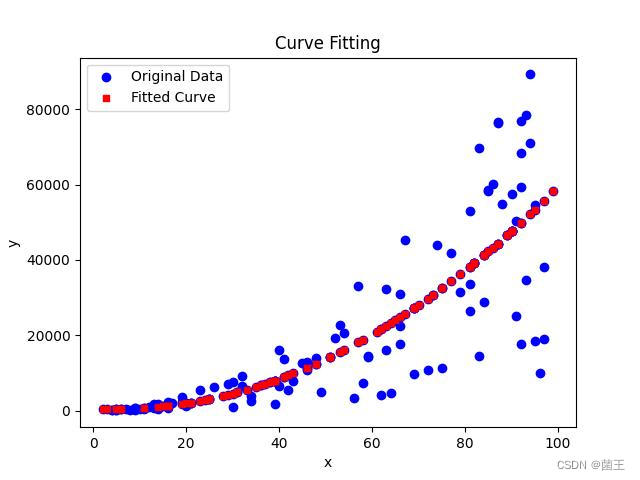
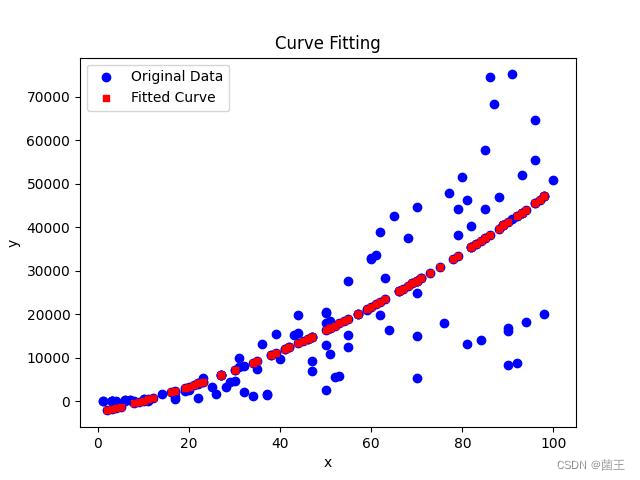
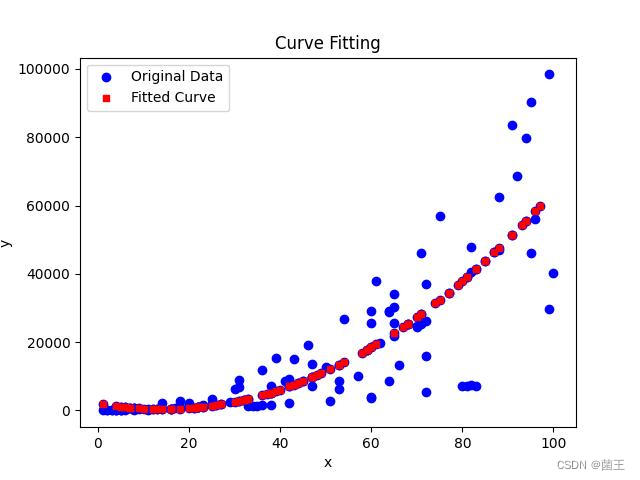
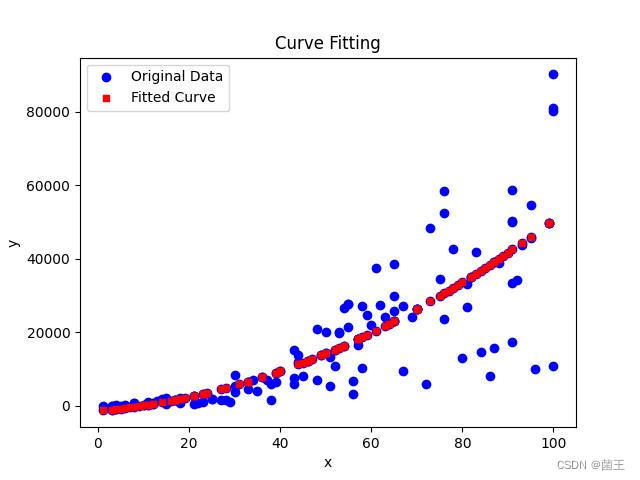
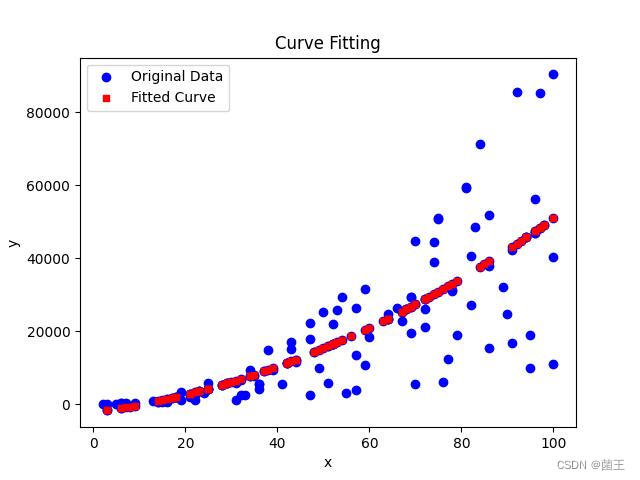
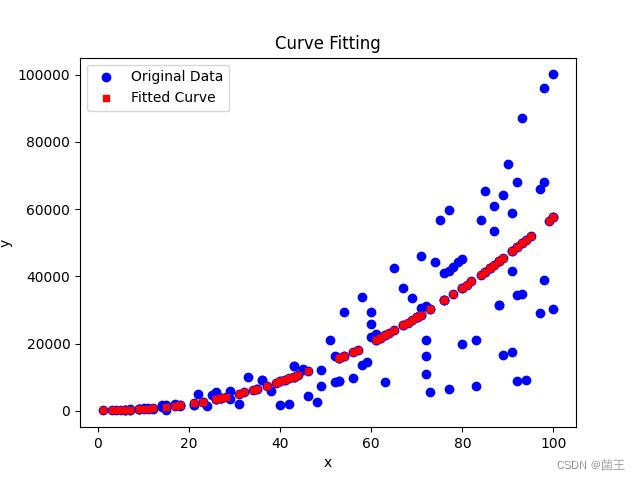
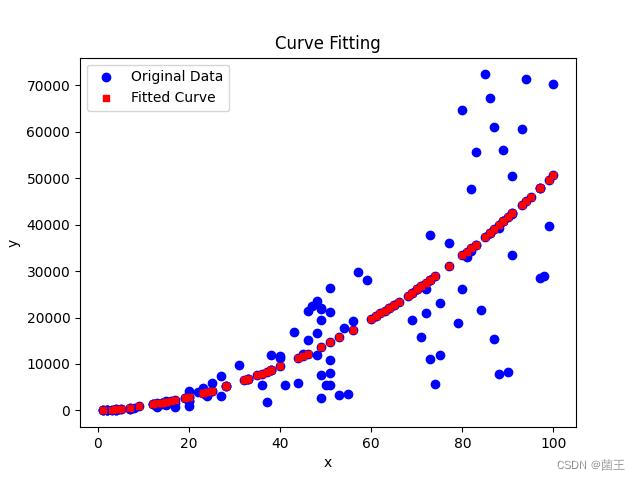
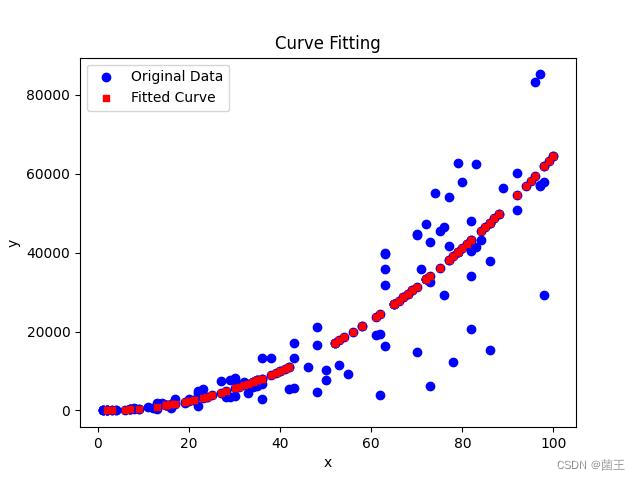
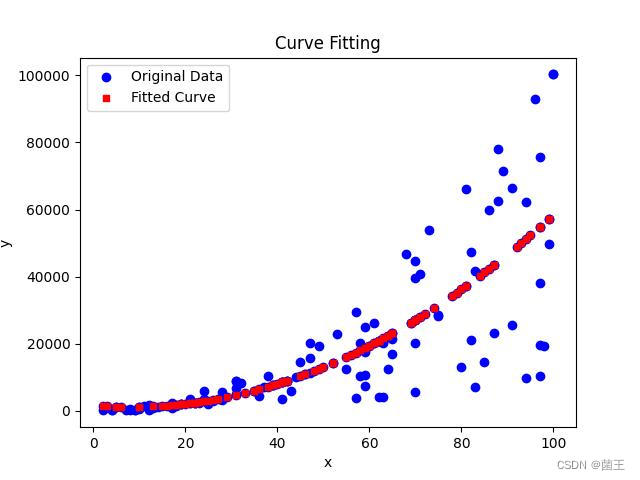
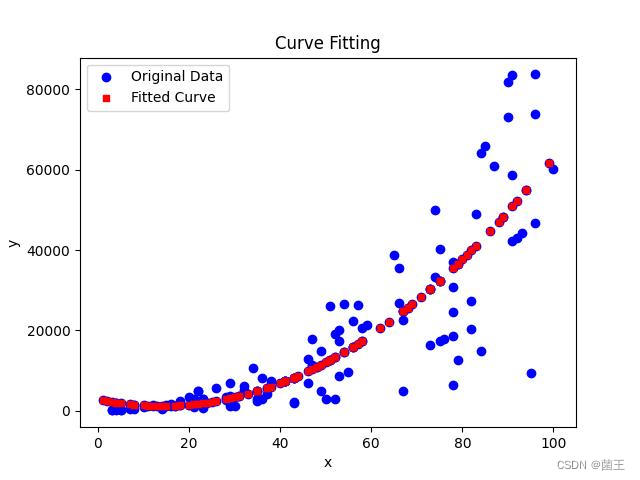
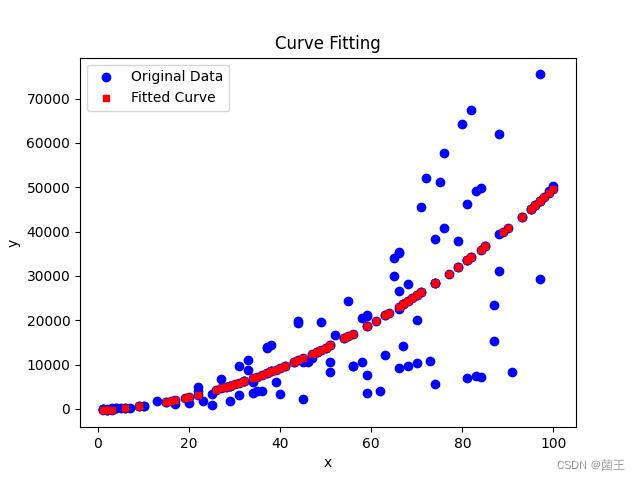
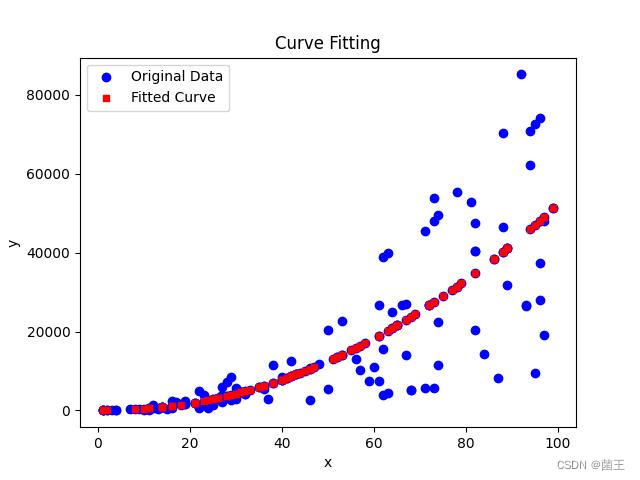
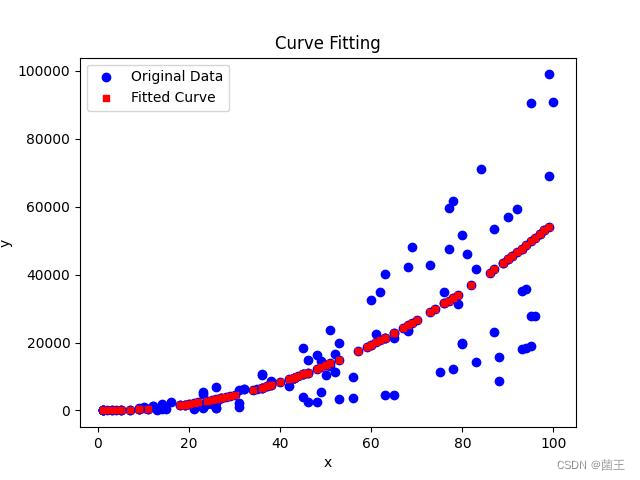
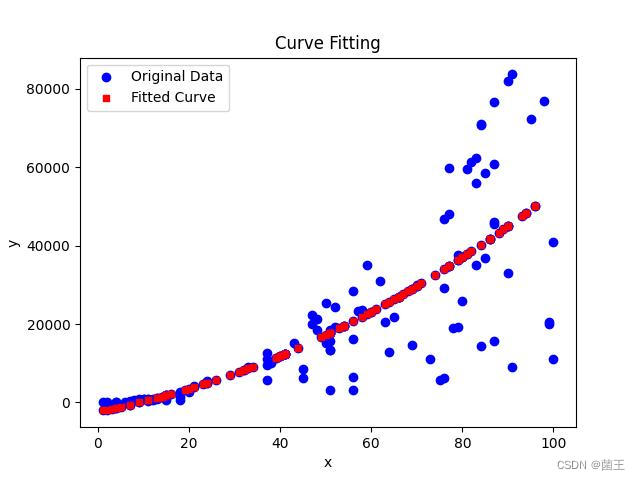
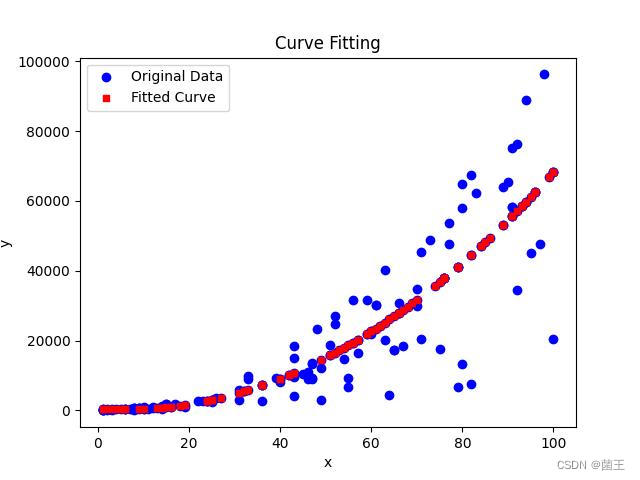
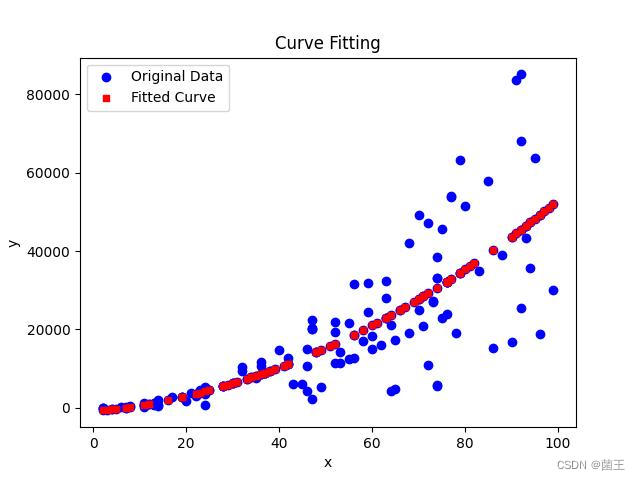
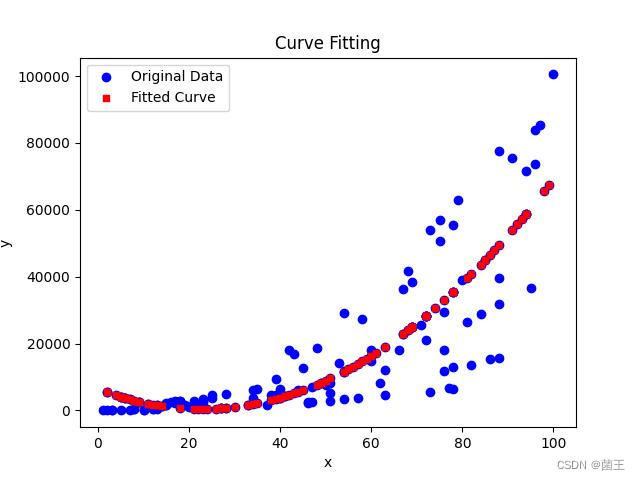
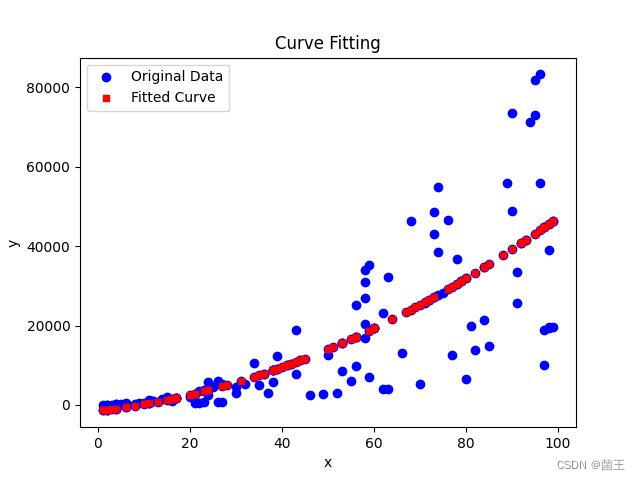
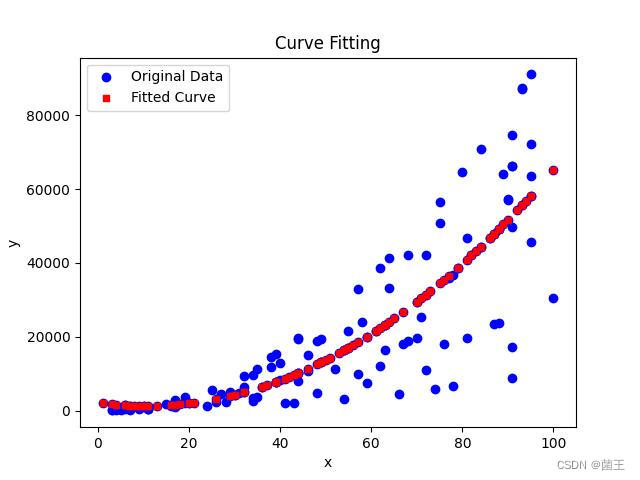
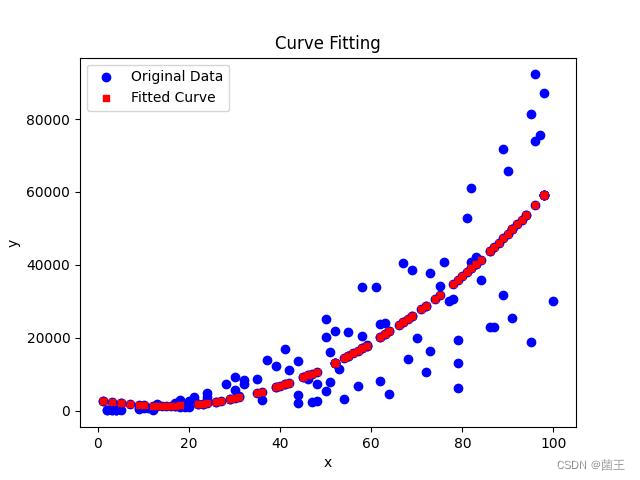
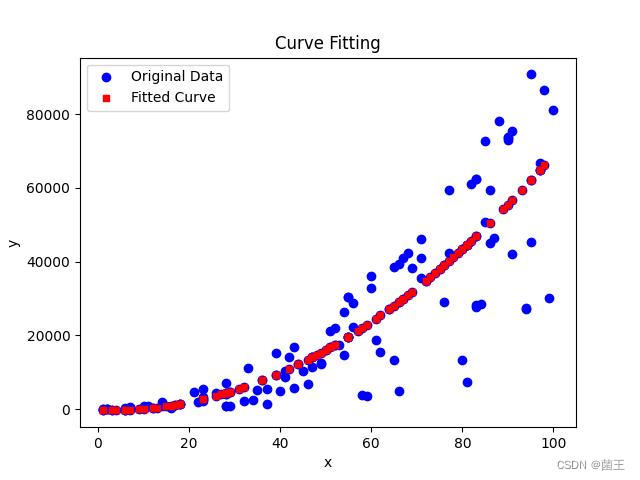
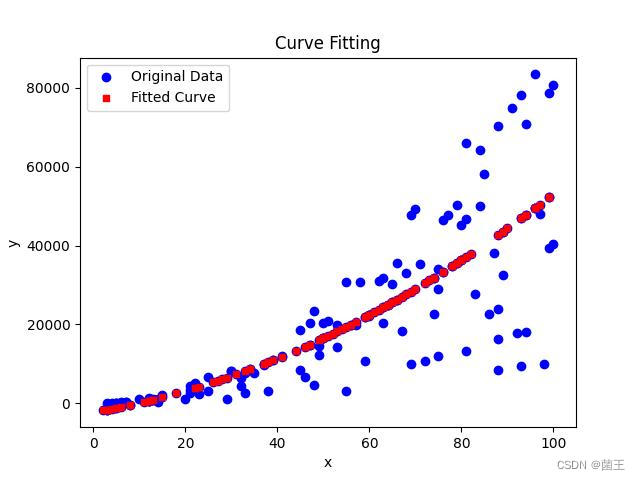
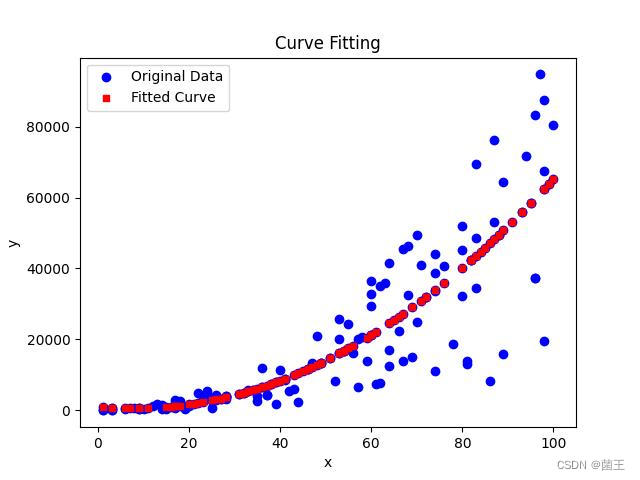
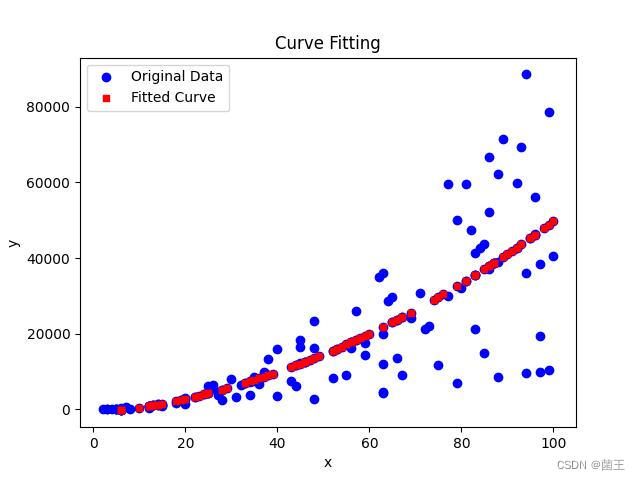
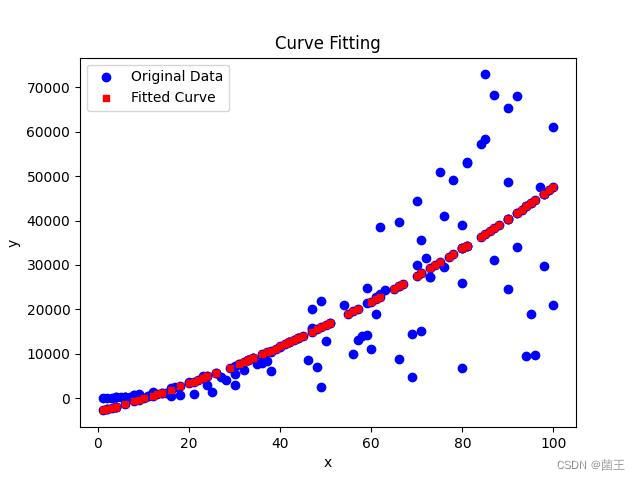
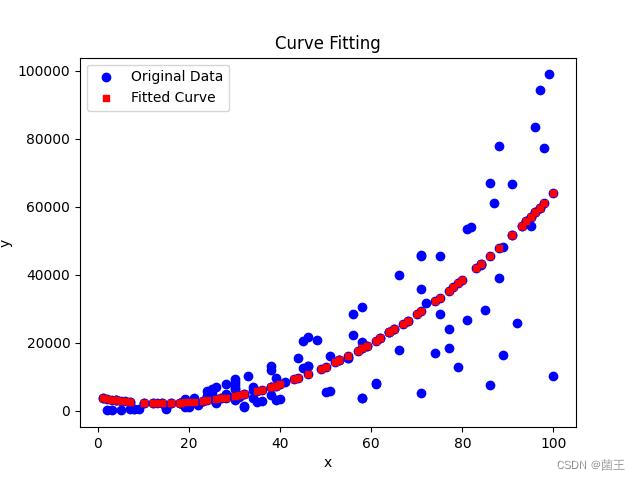
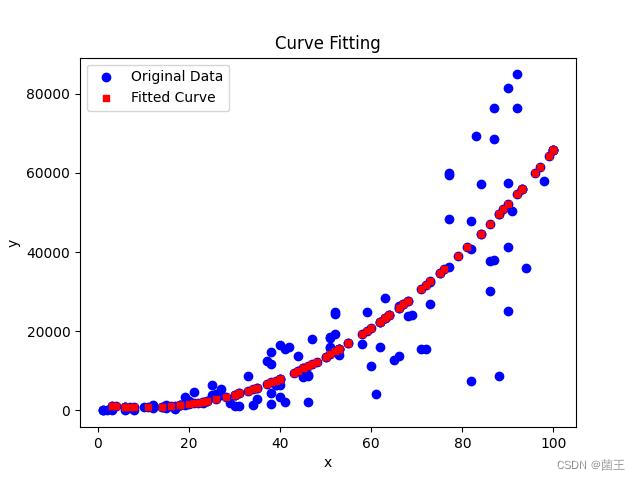
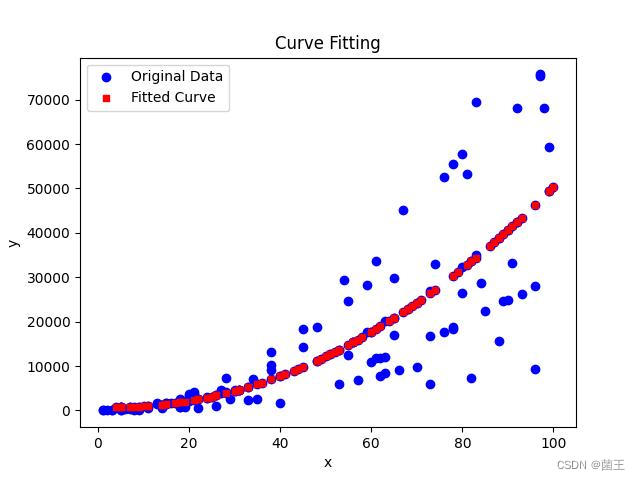
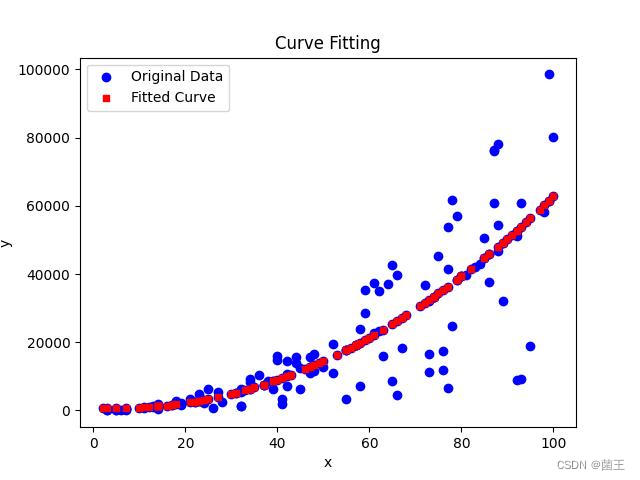
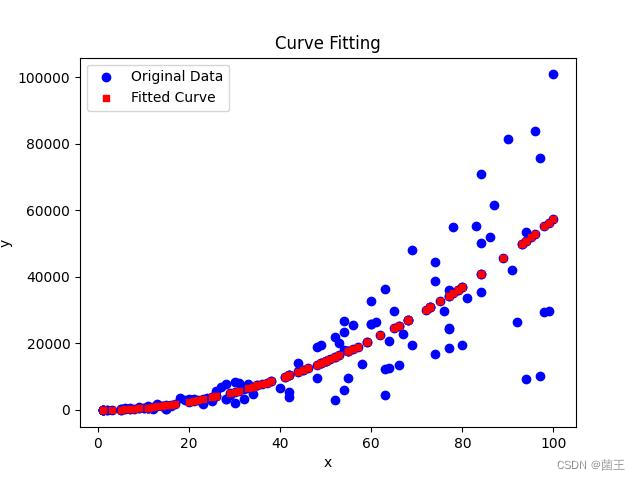
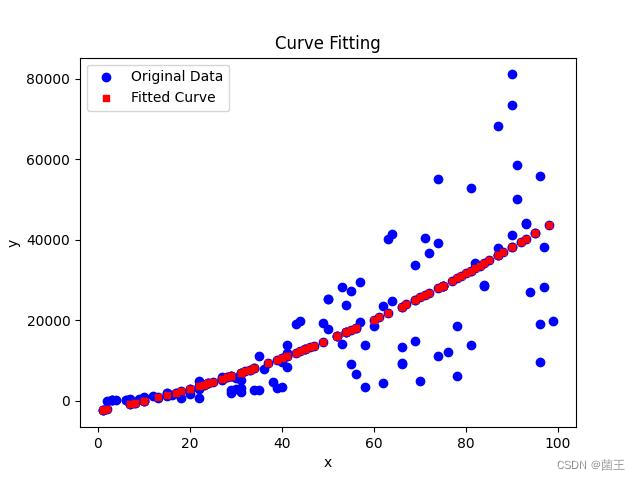
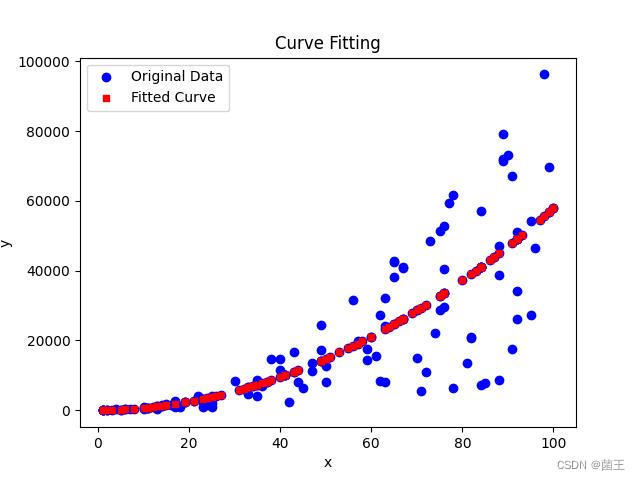
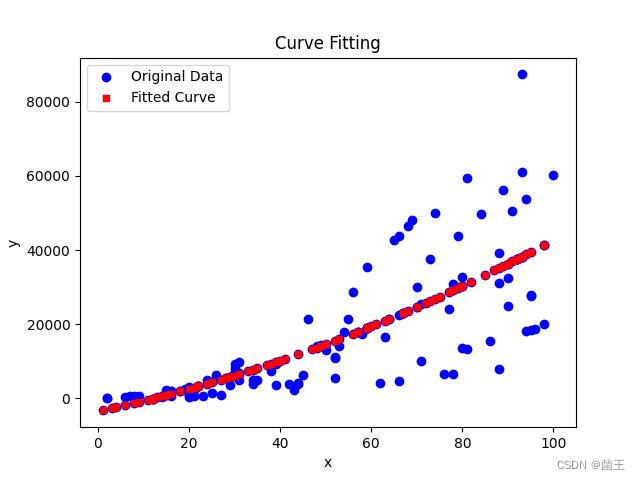
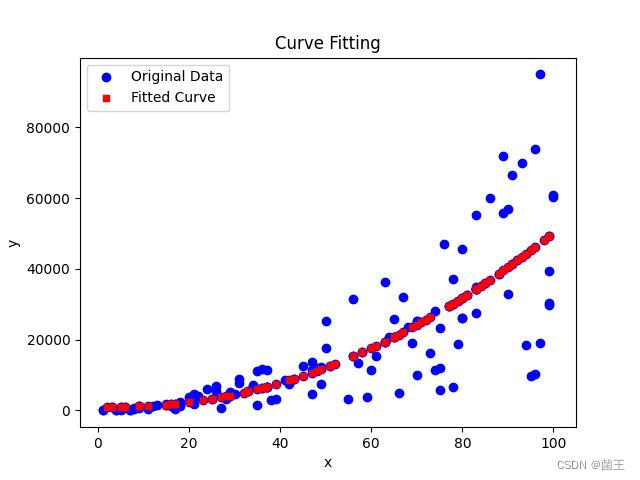
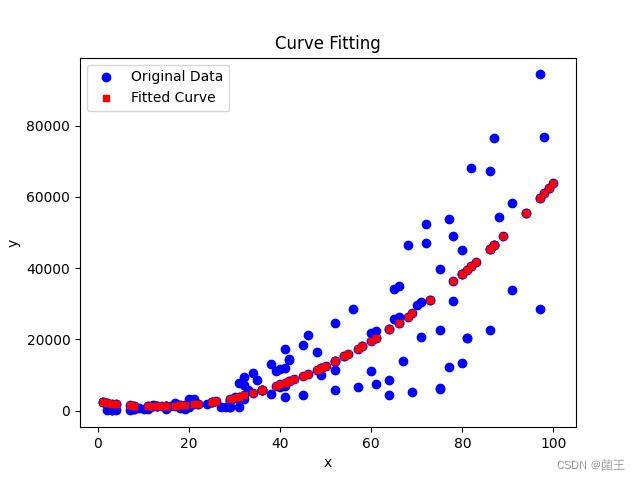
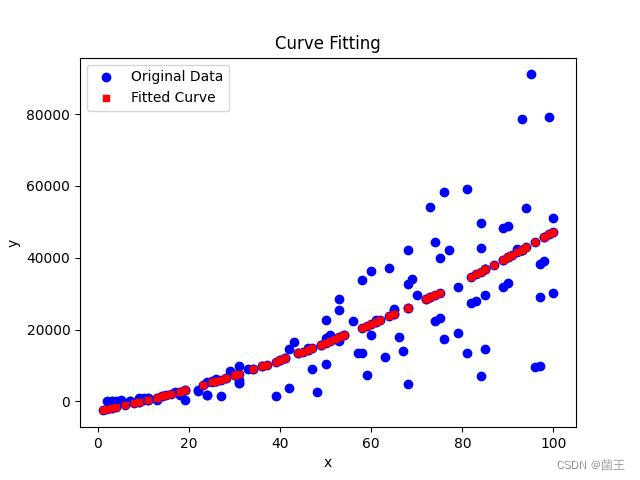
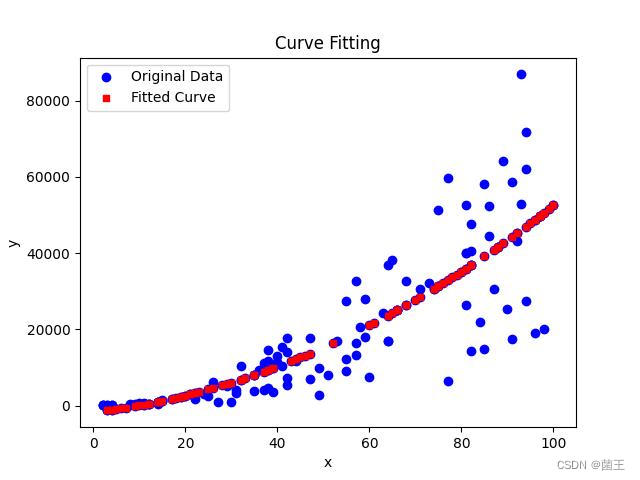
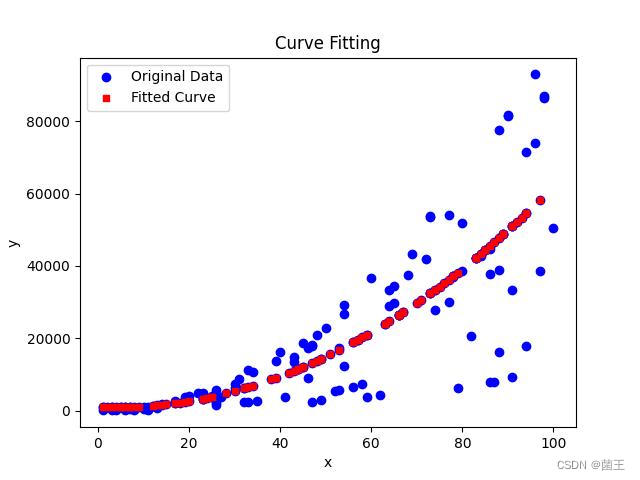
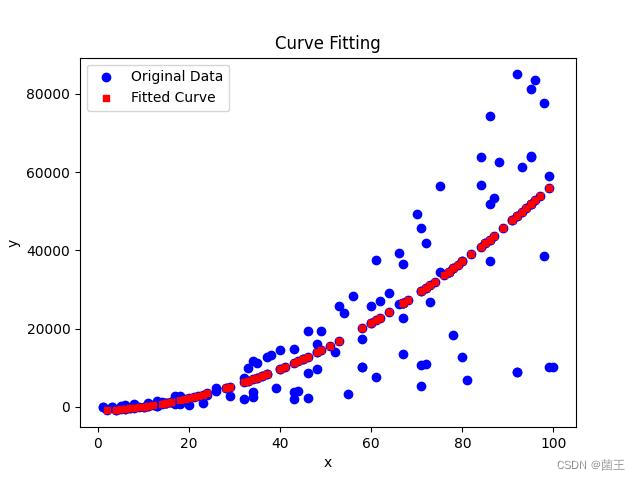
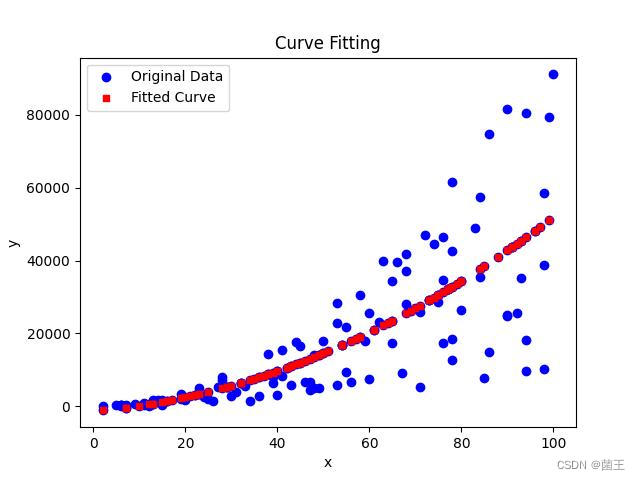
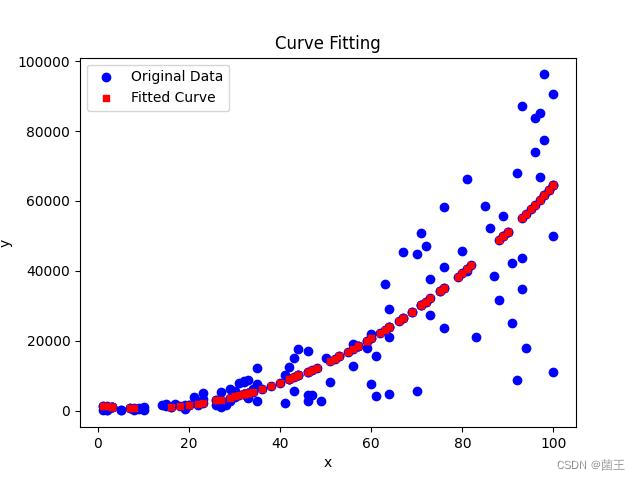
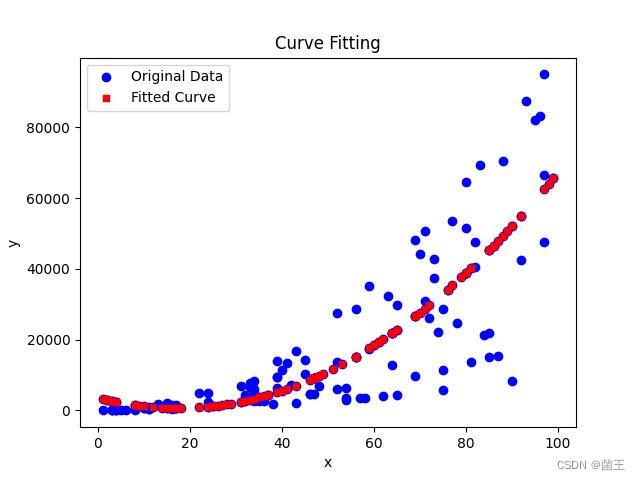
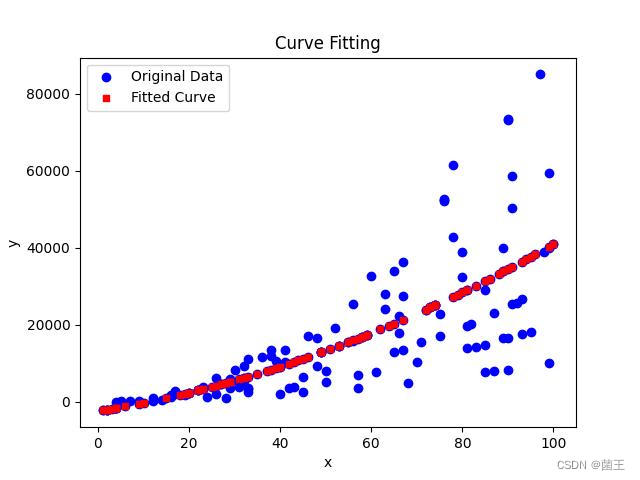
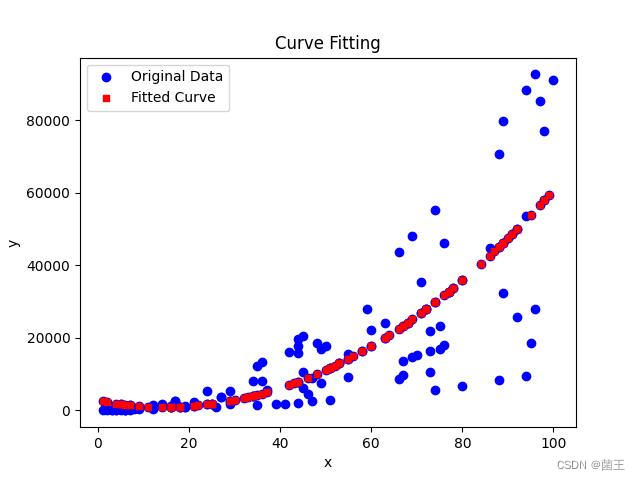
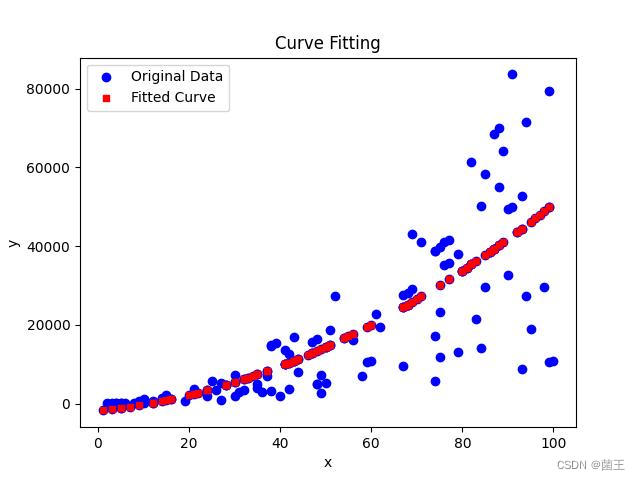
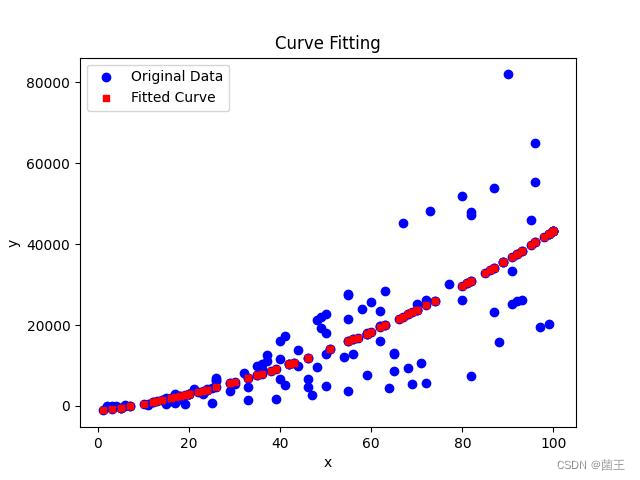
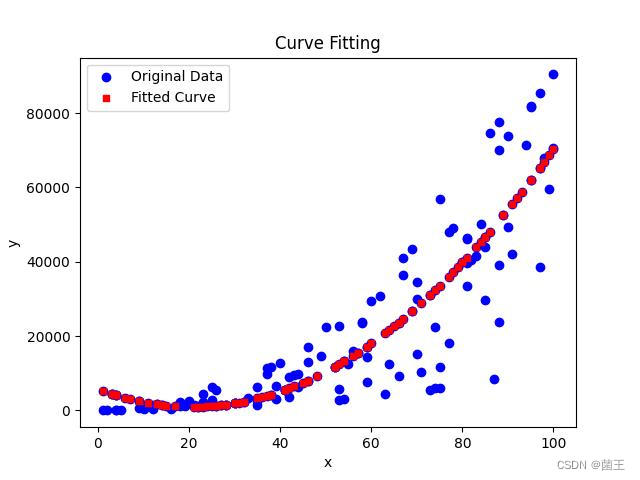
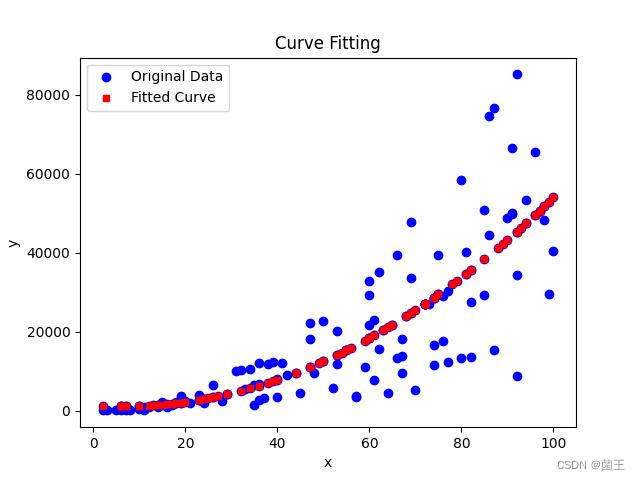
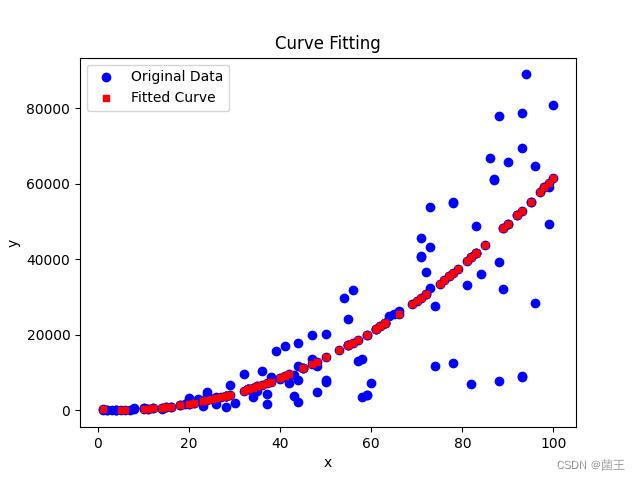
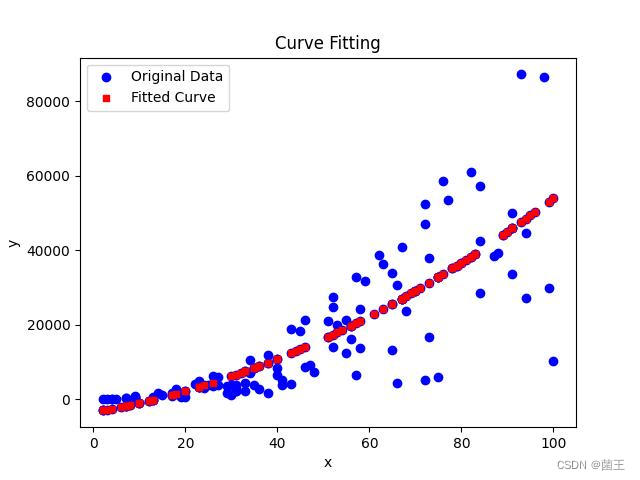
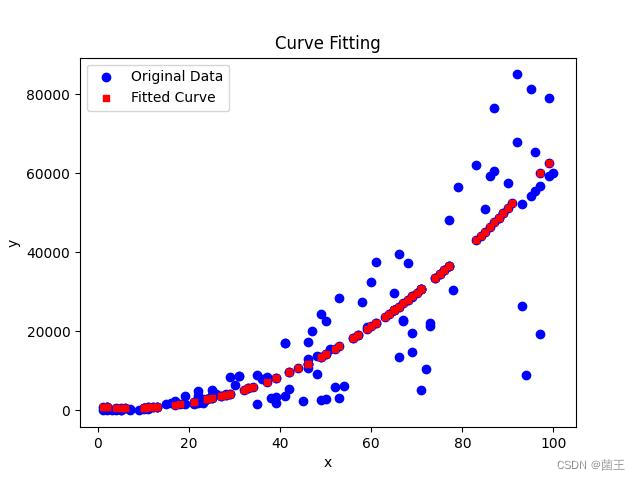
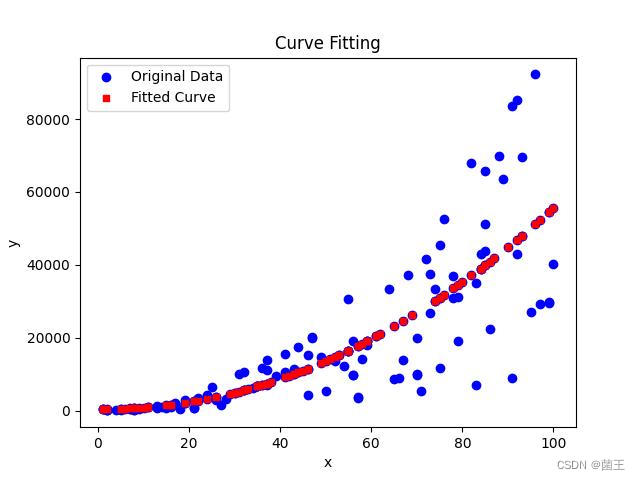
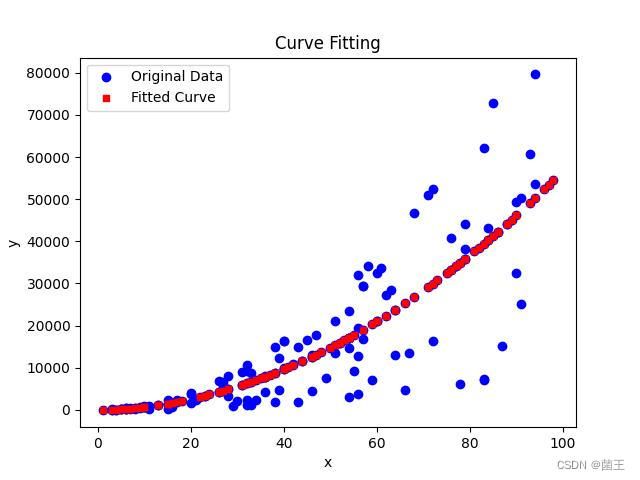
使用python的最小二乘法拟合二次曲线,根据新的数据,不断拟合二次曲线的系数
使用python的最小二乘法拟合二次曲线,根据新的数据,不断拟合二次曲线的系数
·
import matplotlib
import openpyxl
from scipy.optimize import curve_fit

matplotlib.use('TkAgg')  # 设置matplotlib的后端为TkAgg
import matplotlib.pyplot as plt
import os
import random
import time
from datetime import datetime


def create_xlsx():
    # 创建新的Excel文件my_data.xlsx,并添加x,y列
    workbook = openpyxl.Workbook()
    sheet = workbook.active
    sheet.title = "Data"
    sheet['A1'] = "x"
    sheet['B1'] = "y"
    workbook.save("my_data.xlsx")
    workbook.close()
    print("my_data.xlsx已创建")
    time.sleep(2)
    generate_data()


def generate_data():
    # 生成200组x的随机数据
    workbook = openpyxl.load_workbook("my_data.xlsx")
    sheet = workbook.active
    x_data = []
    for i in range(2, 202):
        x = random.randint(1, 100)
        print(x)
        sheet['A' + str(i)] = x
        x_data.append(x)
    workbook.save("my_data.xlsx")
    print("x列数据已生成")

    # 根据公式生成y列数据
    for i in range(2, 202):
        a1 = random.randint(1, 10)
        a2 = random.randint(1, 10)
        a3 = random.randint(1, 10)
        x = x_data[i - 2]
        y = a1 + a2 * x + a3 * x * x + random.random() * 10
        sheet['B' + str(i)] = y
    workbook.save("my_data.xlsx")
    workbook.close()
    print("y列数据已生成")


def is_file_locked(filename):
    # 检查文件是否被其他程序占用
    try:
        open(filename, 'w').close()
        return False
    except IOError:
        return True
    finally:
        os.remove(filename)  # 删除临时文件


def quadratic_func(x, a, b, c):
    return a + b * x + c * x ** 2


def fit_curve(x, y):
    params, _ = curve_fit(quadratic_func, x, y)
    print(params)
    return params


def calculate_y(x, params):
    y = [quadratic_func(xi, *params) for xi in x]
    return y


def plot_curve(x, y, x_fit, y_fit, count):
    plt.clf()  # 清除之前的图形
    # 绘制原始数据
    plt.scatter(x, y, color='blue', marker='o', label='Original Data')

    # 绘制拟合曲线数据
    plt.scatter(x_fit, y_fit, color='red', marker='s', s=25, label='Fitted Curve')

    plt.legend()
    plt.xlabel('x')
    plt.ylabel('y')
    plt.title('Curve Fitting')

    # 保存图片
    now = datetime.now().strftime("%Y%m%d%H%M%S")
    file_name = f'my_data_{now}.jpg'
    plt.savefig(f'结果jpg/{file_name}')

    plt.draw()
    plt.pause(0.5)

    # 添加2秒延迟
    time.sleep(2)

    return file_name


def update_data():
    # 读取数据文件
    workbook = openpyxl.load_workbook('my_data.xlsx')
    sheet = workbook.active
    # 提取x和y列数据
    x = [cell.value for cell in sheet['A'][1:]]
    y = [cell.value for cell in sheet['B'][1:]]
    workbook.close()
    return x, y


# 检查是否存在结果jpg文件夹,如果不存在则创建
if not os.path.exists('结果jpg'):
    os.makedirs('结果jpg')
# 创建一个窗口来显示曲线
plt.figure()

counter = 0  # 计数器
while counter < 100:
    if not os.path.exists("my_data.xlsx"):
        create_xlsx()
    generate_data()
    # 读取my_data.xlsx的数据, 如果没有被占用的话
    x, y = update_data()
    # 使用最小二乘法拟合二次函数
    params = fit_curve(x[:100], y[:100])  # 根据前100组数据进行拟合

    # 计算后100组y的值
    x_fit = x[100:]  # 根据前100组数据拟合的曲线,计算所有200组数据
    y_fit = calculate_y(x_fit, params)

    # 合并前后100组x和y
    x_combined = x[:100] + x_fit
    y_combined = y[:100] + y_fit

    # 绘制曲线并保存图片,返回图片文件名
    file_name = plot_curve(x_combined, y_combined, x_fit, y_fit, counter)
    counter += 1
    print(f'第 {counter} 次迭代:保存图片为 {file_name}')

汇聚全球AI编程工具,助力开发者即刻编程。
更多推荐


 0
0 0
0- 0


 已为社区贡献1条内容

所有评论(0)