
深入 Linux C/C++ 调试工具之 tiptop(IPC 高低一目了然)
目录
一、前言——tiptop 工具简介
1.1 什么是 tiptop
tiptop 是面向 Linux 的 硬件性能计数器(Hardware Performance Counter, HPC / PMC)实时监控工具,界面类似 top,但主要展示的是各任务的 IPC、周期、指令数、末级缓存缺失 等由硬件计数器推导出的指标,而不是单纯的 %CPU / 内存占比。
一句话定位:
tiptop 是进程级的 「CPU 效率透视镜」 —— top 告诉你「谁在忙」,tiptop 告诉你「忙得有效率吗、是不是在喂缓存」。
项目源自 Inria(研究报告 RR-7789),通过 perf_event_open 为任务挂接计数器,适合编译器、架构与应用开发者快速判断微架构瓶颈。
1.2 与相关工具对比
|
工具 |
数据来源 |
典型场景 |
|---|---|---|
|
tiptop |
硬件计数器,类 top 实时/批量 |
按进程看 IPC、LLC miss |
|
top / htop |
|
谁占 CPU、谁占内存 |
|
perf top / record |
同属 perf 子系统,采样/记录更强 |
热点函数、火焰图 |
|
perf stat |
整段命令汇总计数 |
单次跑分、对比优化前后 |
|
pcm / likwid |
更偏系统/核级计数 |
整机带宽、功耗 |
服务 CPU 很高但吞吐上不去
  ├─ top          →  确认是哪个进程/线程在烧
  ├─ tiptop       →  IPC 低?LLC miss 高?分支乱?
  ├─ perf record  →  热点落在哪个函数
  └─ 改算法/数据结构 / 绑核 / 减伪共享
二、使用场景——何时使用 tiptop
1、C/C++ 服务「CPU 高、QPS 低」
典型现象: top 里 %CPU 接近打满,业务指标却差。
tiptop -p my_server
# 或
tiptop -p $(pidof my_server)
看 IPC:长期明显偏低(视架构,常关注相对基线)→ 可能在等内存/缓存,而不是「算力不够」。
2、怀疑缓存不友好 / 伪共享
tiptop -H -p my_server多线程下某 TID 的 LLC miss / miss 比率 异常高 → 查数据结构、跨核写、false sharing。
3、对比优化前后(批量模式落盘)
tiptop -b -d 1 -n 30 -p my_app | tee before.txt
# 优化后
tiptop -b -d 1 -n 30 -p my_app | tee after.txt
适合回归:同一负载下 IPC、miss 是否改善。
4、跟着新进程跑完再结束
tiptop -b --sticky -- ./my_bench只跟踪新拉起的程序,退出后仍可在 sticky 下列出(batch 下标记 DEAD)。
5、编译器 / 代码生成效果粗评
同一测试集,对比 -O0 vs -O2、不同数据结构实现:看指令数与 IPC 变化趋势(精细分析仍建议 perf)。
6、和 top 联用:先定位进程,再看微架构
top -p $(pidof my_server)     # 确认忙
tiptop -H -p $(pidof my_server)  # 看为何忙得「虚」
三、核心原理——工作原理深度解析
3.1 总体数据路径
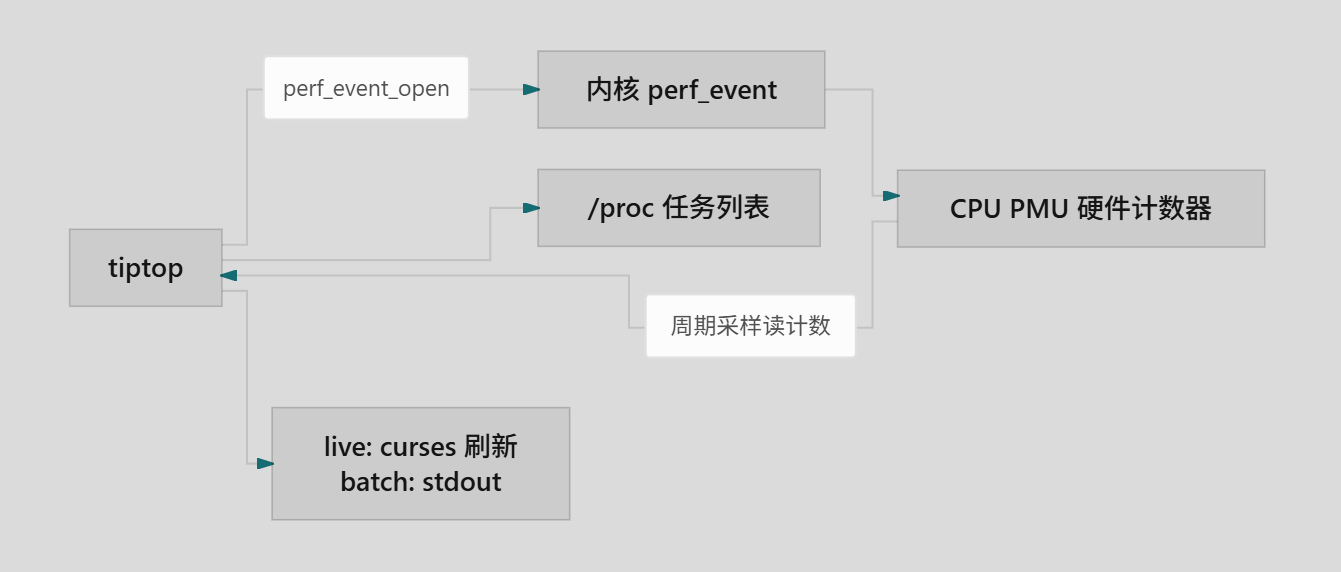
-
扫描任务(可过滤 PID/名字/用户)
-
为任务打开若干
perf_event(instructions、cycles、cache-misses 等) -
按
-d周期读差值,计算比率(如 IPC = Δinstructions / Δcycles) -
live 模式全屏刷新;batch 模式打印到 stdout
3.2 几个核心指标(读屏必备)
|
指标 |
含义 |
粗读法 |
|---|---|---|
|
IPC |
Instructions Per Cycle,每周期指令数 |
相对同机同负载:偏低常暗示停顿多(访存、依赖、分支) |
|
cycles / instructions |
周期与退休指令 |
指令暴涨可能算法变重;周期涨、指令不涨更像等待 |
|
LLC misses / miss ratio |
末级缓存缺失 |
高 → 内存带宽或局部性差 |
|
%CPU(若显示) |
占用概况 |
与 top 交叉验证「谁在跑」 |
不同 CPU(Intel/AMD/ARM)绝对 IPC「好线」不同,重相对对比与同机基线,勿死记一个阈值。
3.3 屏幕(Screen)与配置文件
tiptop 可用 XML 配置定义多个 screen:每屏一组 counter + 若干列表达式。默认屏通常已含常用事件;进阶可把手册中的 raw event 配进去。
tiptop -W /path/to/tiptop.xml
tiptop -S 0          # 按屏编号
tiptop -S cache      # 名字包含 cache 的屏
交互模式下常用 左右方向键 切换 screen。
3.4 与 perf 的关系
|
tiptop |
perf |
|
|---|---|---|
|
目标 |
多任务实时「仪表盘」 |
记录、采样、符号化、脚本生态 |
|
深度 |
进程/线程级比率 |
可到函数/指令 |
|
典型下一步 |
发现 IPC/miss 异常 |
|
tiptop 不替代 perf,而是 更快给出「该不该上 perf」的信号。
3.5 文件描述符与进程涨落
每个被监控任务要占若干 fd(每事件一个)。进程极多时可能触达 ulimit -n。默认会尝试回收空闲任务的 fd 给新进程;--no-collect 关闭该行为。
四、命令参数——常用选项详解
4.1 运行模式
|
选项 |
含义 |
|---|---|
|
(默认) |
live-mode:类 top 交互界面 |
|
|
batch-mode:输出到 stdout,不可交互 |
|
|
刷新 N 次后退出(常与 |
|
|
刷新间隔(可小数,须 > 0.01) |
4.2 过滤与显示
|
选项 |
含义 |
|---|---|
|
|
按 PID 数字或名字/命令行子串过滤 |
|
|
只显示某用户 |
|
|
watch 指定任务 |
|
|
显示线程 |
|
|
显示空闲任务(配合 |
|
|
显示完整命令行(toggle) |
|
|
显示用户(toggle) |
|
|
计入内核态活动(若内核/权限允许) |
|
|
任务退出后仍留在列表 |
|
|
行首时间戳 / Epoch |
|
|
选择 screen |
|
|
指定配置文件 |
4.3 交互键(live 模式,因版本略异)
|
操作 |
常见作用 |
|---|---|
|
左 / 右 |
切换 screen |
|
|
换排序列 |
|
|
切换命令行显示 |
|
|
退出 |
|
|
帮助 |
以本机 man tiptop 为准。
4.4 高频命令清单
tiptop                              # 默认可视化
tiptop -H -p my_server              # 按名看线程
tiptop -p 12345 -d 0.5              # 盯单个 PID,快刷新
tiptop -b -d 1 -n 20 -p my_app      # 批量采样 20 次
tiptop -b --sticky -- ./bench       # 跟着 bench 跑
tiptop -S 0 -u www-data             # 某屏 + 某用户
五、使用实战——实际案例分析
5.1 准备工作
文件tiptop_demo.c
#include <pthread.h>
#include <signal.h>
#include <stdint.h>
#include <stdio.h>
#include <stdlib.h>
#include <string.h>
#include <time.h>
#include <unistd.h>

#ifndef BUF_ELEMS
#define BUF_ELEMS (32 * 1024 * 1024 / sizeof(uint32_t)) /* ~32MB */
#endif

static volatile int g_stop;

static void on_alarm(int sig)
{
	(void)sig;
	g_stop = 1;
}

static void arm(int sec)
{
	signal(SIGALRM, on_alarm);
	alarm((unsigned)sec);
}

static uint64_t now_ns(void)
{
	struct timespec ts;
	clock_gettime(CLOCK_MONOTONIC, &ts);
	return (uint64_t)ts.tv_sec * 1000000000ull + (uint64_t)ts.tv_nsec;
}

static void run_compute(int sec)
{
	volatile double x = 1.0;
	uint64_t ops = 0;

	printf("pid=%d mode=compute sec=%d (expect higher IPC)\n", getpid(),
	       sec);
	printf("  tiptop -b -d 1 -n %d -p tiptop_demo\n", sec > 3 ? sec : 10);
	arm(sec);
	while (!g_stop) {
		int i;
		for (i = 0; i < 10000; i++)
			x = x * 1.0000001 + 0.0000001;
		ops++;
	}
	printf("done ops=%llu x=%f\n", (unsigned long long)ops, (double)x);
}

static void run_cache_miss(int sec)
{
	uint32_t *buf;
	size_t n = BUF_ELEMS;
	uint64_t sum = 0, steps = 0;
	size_t i;

	buf = malloc(n * sizeof(uint32_t));
	if (!buf) {
		perror("malloc");
		exit(1);
	}
	for (i = 0; i < n; i++)
		buf[i] = (uint32_t)(i * 2654435761u);

	printf("pid=%d mode=cache-miss buf≈%zuMB sec=%d (expect lower IPC / more misses)\n",
	       getpid(), (n * sizeof(uint32_t)) >> 20, sec);
	printf("  tiptop -b -d 1 -n %d -p tiptop_demo\n", sec > 3 ? sec : 10);

	srand(1);
	arm(sec);
	while (!g_stop) {
		size_t idx = (size_t)rand() % n;
		sum += buf[idx];
		/* 再跳一次,打乱预取 */
		idx = (idx * 1103515245u + 12345u) % n;
		sum += buf[idx];
		steps++;
	}
	printf("done steps=%llu sum=%llu\n", (unsigned long long)steps,
	       (unsigned long long)sum);
	free(buf);
}

struct thr_arg {
	int id;
	int sec;
};

static void *thr_compute(void *arg)
{
	struct thr_arg *a = arg;
	volatile double x = 1.0 + a->id;

	while (!g_stop) {
		int i;
		for (i = 0; i < 10000; i++)
			x = x * 1.0000001 + 0.0000001;
	}
	(void)x;
	return NULL;
}

static void run_threads(int n, int sec)
{
	pthread_t *th;
	struct thr_arg *args;
	int i;

	if (n < 1)
		n = 1;
	th = calloc((size_t)n, sizeof(*th));
	args = calloc((size_t)n, sizeof(*args));
	if (!th || !args) {
		perror("calloc");
		exit(1);
	}

	printf("pid=%d mode=threads n=%d sec=%d\n", getpid(), n, sec);
	printf("  tiptop -H -p tiptop_demo\n");
	arm(sec);
	for (i = 0; i < n; i++) {
		args[i].id = i;
		args[i].sec = sec;
		if (pthread_create(&th[i], NULL, thr_compute, &args[i]) != 0) {
			perror("pthread_create");
			exit(1);
		}
	}
	for (i = 0; i < n; i++)
		pthread_join(th[i], NULL);
	free(th);
	free(args);
}

static void usage(const char *argv0)
{
	fprintf(stderr,
		"Usage:\n"
		"  %s compute     [sec]\n"
		"  %s cache-miss  [sec]\n"
		"  %s threads     [n] [sec]\n",
		argv0, argv0, argv0);
}

int main(int argc, char **argv)
{
	const char *mode;
	int a = 20, b = 20;
	uint64_t t0;

	if (argc < 2) {
		usage(argv[0]);
		return 1;
	}
	mode = argv[1];
	if (argc >= 3)
		a = atoi(argv[2]);
	if (argc >= 4)
		b = atoi(argv[3]);
	if (a <= 0)
		a = 1;
	if (b <= 0)
		b = 1;

	t0 = now_ns();
	printf("tiptop_demo start t0_ns=%llu\n", (unsigned long long)t0);

	if (!strcmp(mode, "compute"))
		run_compute(a);
	else if (!strcmp(mode, "cache-miss"))
		run_cache_miss(a);
	else if (!strcmp(mode, "threads"))
		run_threads(a, argc >= 4 ? b : 20);
	else {
		usage(argv[0]);
		return 1;
	}
	return 0;
}
Makefile
CC      ?= gcc
CFLAGS  ?= -Wall -Wextra -O2
LDFLAGS ?= -pthread
TARGET  := tiptop_demo

.PHONY: all clean check help

all: $(TARGET)

$(TARGET): tiptop_demo.c
	$(CC) $(CFLAGS) -o $@ $< $(LDFLAGS)

check: $(TARGET)
	@echo "=== tiptop ==="
	@tiptop --help 2>&1 | head -5 || echo "tiptop not installed (apt/dnf install tiptop)"
	@echo "perf_event_paranoid=$$(cat /proc/sys/kernel/perf_event_paranoid 2>/dev/null || echo n/a)"
	@echo ""
	@echo "Examples:"
	@echo "  ./$(TARGET) compute 20"
	@echo "  ./$(TARGET) cache-miss 20"
	@echo "  tiptop -b -d 1 -n 10 -p tiptop_demo"

clean:
	$(RM) $(TARGET)

help:
	@echo "make && make check"
	@echo "./tiptop_demo compute|cache-miss|threads ..."
5.2 案例一:总览谁在「低效忙碌」
tiptop
# 观察 IPC 偏低且 %CPU 高的进程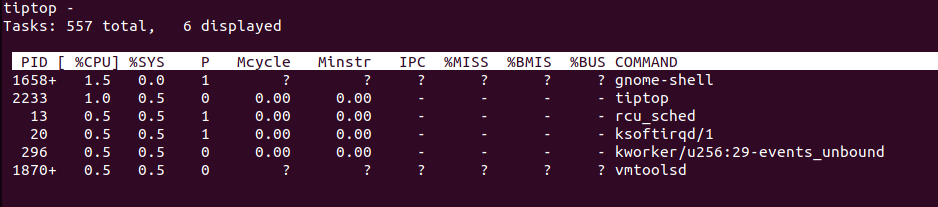
读法: 高 CPU + 低 IPC → 优先查内存子系统与锁等待;高 CPU + 高 IPC → 更像纯算力型热点,再上 perf top 看函数。
5.3 案例二:对比两种 C 负载(推荐)
# 终端 A:计算密集、局部性好
./tiptop_demo compute 30

# 终端 B
tiptop -b -d 1 -n 10 -p tiptop_demo
# 终端 A:大数组随机读(折磨缓存)
./tiptop_demo cache-miss 30
# 终端 B
tiptop -b -d 1 -n 10 -p tiptop_demo期望: cache-miss 模式相对 compute,IPC 更低或 LLC miss 相关列更高(具体列名取决于默认 screen)。
5.4 案例三:多线程与 -H
./tiptop_demo threads 4 30 &
tiptop -H -p tiptop_demo
看各 TID 的 IPC 是否失衡(一核忙算、一核在自旋/访存)。
5.5 案例四:批量落盘做优化对比
tiptop -b -d 1 -n 15 -p tiptop_demo --timestamp | tee /tmp/tt_compute.txt
# 换实现或编译选项后再采一版,diff 关注 IPC / miss 列均值
5.6 案例五:跟着基准程序
tiptop -b -d 1 --sticky -- ./tiptop_demo compute 10适合 CI/脚本:无需先查 PID。
5.7 案例六:与 perf stat 交叉验证
# 同一负载
perf stat -e cycles,instructions,cache-misses ./tiptop_demo cache-miss 5
tiptop -b -d 1 -n 5 -p tiptop_demo
两者数量级应同向;perf 给汇总,tiptop 给过程中多任务视图。
5.8 案例七:生产安全用法
# 只盯目标,降低开销与噪音
tiptop -b -d 2 -n 30 -p my_server -H | tee tiptop_$(date +%s).log
避免在计数器受限的容器里长时间全量 live(先确认 paranoid 与 cgroup 是否允许)。
六、常见问题——疑难解答
6.1 启动报错 / 全 0 / 无事件
|
原因 |
处理 |
|---|---|
|
|
按策略调整或用有权限的账号 |
|
容器未放行 perf |
加 capability / 改运行时配置,或改在宿主机采 |
|
CPU/VM 未暴露 PMU |
部分云主机/嵌套虚拟化不可用 |
|
事件不支持 |
换 screen 或改 XML 配置 |
6.2 和 top 的 %CPU 对不上?
采样窗口、是否含内核(-K)、是否按线程(-H)都不同。先对齐 PID/TID 与刷新周期再比趋势。
6.3 IPC「多少算正常」?
无统一阈值。在同机器、同负载下建立基线;优化后看相对提升。跨代 CPU 比较绝对 IPC 意义有限。
6.4 进程太多、部分任务没数据?
fd 耗尽。提高 ulimit -n,或用 -p 收窄范围;了解默认 collect 回收策略与 --no-collect。
6.5 live 模式花屏 / 无界面?
缺 ncurses 或终端类型不对;改用 tiptop -b。
6.6 开销会不会很大?
为多进程挂多事件有成本。生产优先 过滤 PID + 较大 -d + 有限 -n;深度剖析再用 perf record 短时采样。
七、总结——要点回顾
-
tiptop 用硬件计数器按任务展示 IPC / miss 等效率指标,补齐 top「只知忙不知为何忙」的缺口。
-
低 IPC、高 LLC miss 是上 perf 深挖前的强信号。
-
batch + 过滤 PID 适合脚本与优化前后对比;精细到函数仍靠 perf。

汇聚全球AI编程工具,助力开发者即刻编程。
更多推荐
 6
6 0
0- 0


 已为社区贡献2条内容

所有评论(0)