
Grafana-Echarts配置项讲解
·
一、Grafana ECharts 基本结构
Grafana 用的是 (echarts-panel),核心是一段 JS 函数,最后 return 一个标准 ECharts option
function(data, context) {
  // 1. 取数据:data.series / data.fields / data.timeRange ...
  // 2. 组装成 ECharts 的 option
  let option = {
    // 标准 ECharts 配置
  };
  return option;
}

//对于旧版可以直接定义
let option = {
    // 标准 ECharts 配置
  };
return option;
在 ECharts 代码中添加打印语句
// Grafana 会自动将查询结果注入到全局变量 data 中
console.log("=== 完整 Grafana 数据结构 ===", data);
console.log("=== 数据系列列表 ===", data.series);
console.log("=== 查询状态 ===", data.state);
console.log("=== 数据系列数量 ===", data.series.length);


// 系列A
const seriesA = data.series.find(s => s.refId === "A");
console.log("\n=== 系列A(数值数据)详情 ===", seriesA);
console.log("系列A字段定义:", seriesA.fields);
const timeFieldA = seriesA.fields.find(f => f.type === "time");
const valueFieldA = seriesA.fields.find(f => f.name === "valueFloat");

// 系列B
const seriesB = data.series.find(s => s.refId === "B");
console.log("\n=== 系列B(字符串数据)详情 ===", seriesB);
console.log("系列B字段定义:", seriesB.fields);

...
示例:
软件版本:grafana v8.2.7 + InfluxDB 1.X + echart 2.2.4
Grafana中的查询SQL
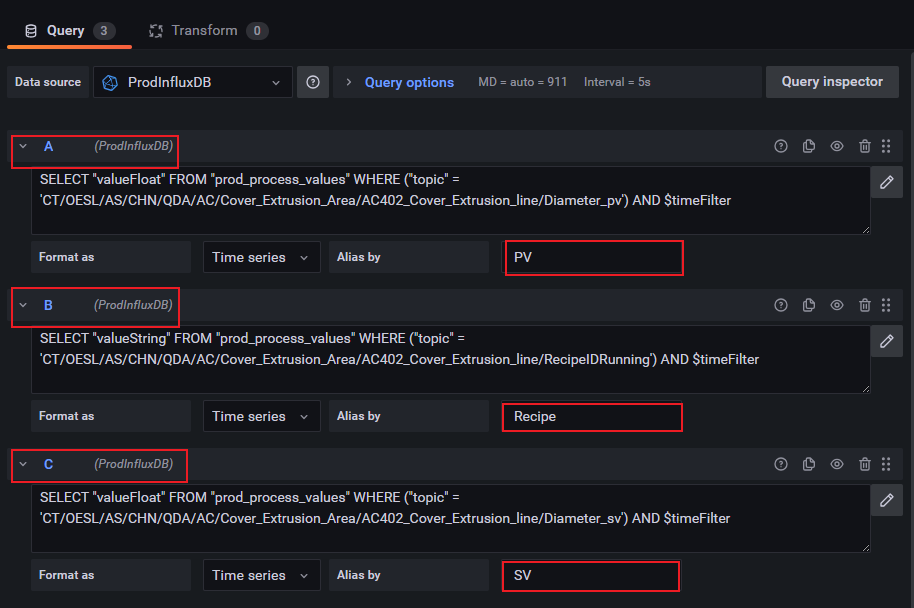
通过打印数据结构:console.log("=== 完整 Grafana 数据结构 ===", data);
打印出的是Grafana v8.x 特有的 "字段值数组" 格式,每个字段独立存储自己的所有值,而不是按行存储。
// 根对象 data
{
  state: "Done",                // 查询状态
  series: [                     // 3个数据系列,对应你的3个查询A/B/C
    // 系列0:查询A - PV(过程值)
    {
      name: "PV",               // 系列名称
      refId: "A",               // 对应查询面板的查询ID
      length: 774,              // 数据点总数(774个时间点)
      meta: { executedQueryString: "..." }, // 实际执行的SQL
      fields: [                 // 2个字段:时间 + 数值
        // 字段0:时间字段
        {
          name: "Time",
          type: "time",
          values: [1716123456000, 1716123457000, ...], // 774个时间戳(毫秒)
          config: {},
          state: {}
        },
        // 字段1:数值字段
        {
          name: "Value",
          type: "number",
          values: [23.5, 24.1, 23.8, ...], // 774个PV值
          labels: undefined
        }
      ]
    },
    // 系列1:查询B - Recipe(配方)
    {
      name: "Recipe",
      refId: "B",
      length: 8,                // 只有8个数据点
      fields: [
        { name: "Time", type: "time", values: [...] }, // 8个时间戳
        { name: "Value", type: "number", values: [...] }  // 8个配方值
      ]
    },
    // 系列2:查询C - SV(设定值)
    {
      name: "SV",
      refId: "C",
      length: 8,                // 只有8个数据点
      fields: [
        { name: "Time", type: "time", values: [...] }, // 8个时间戳
        { name: "Value", type: "number", values: [...] }  // 8个设定值
      ]
    }
  ],
  timeRange: { from: T, to: T }, // 当前面板时间范围
  annotations: [],
  error: undefined,
  request: { ... },
  structureRev: 8,
  timings: { dataProcessingTime: 0 }
}
二、数据提取
console.log("=== 完整 Grafana 数据结构 ===", data);
console.log("=== 顶层 series 数组 ===", data?.series ?? []);
console.log("=== 查询状态 ===", data?.state);
console.log("=== 系列总数 ===", Array.isArray(data?.series) ? data.series.length : 0);

/**
 * 工具:安全判断有效非空数组
 * @param {*} arr
 * @returns {boolean}
 */
function isSafeArray(arr) {
  return Array.isArray(arr) && arr.length > 0;
}

/**
 * 按 refId 匹配,返回对应单条系列对象
 * @param {Object|null|undefined} data Grafana 根数据
 * @param {string} refId 查询标识 A/B/C
 * @returns {Object|null} 单个series对象
 */
function getSeriesByRefId(data, refId) {
  if (!data || !isSafeArray(data.series)) return null;
  return data.series.find(item => item.refId === refId) || null;
}

/**
 * 根据字段固定下标提取数值数组
 * 约定:fields[0] = Time,fields[1] = valueInt
 * @param {Object|null} singleSeries 单个series对象
 * @param {number} fieldIndex 0=Time / 1=valueInt
 * @returns {Array} 数据数组,无数据返回[]
 */
function getFieldByIndex(singleSeries, fieldIndex) {
  // 校验series和fields数组
  if (!singleSeries || !isSafeArray(singleSeries.fields)) return [];
  // 下标越界直接返回空
  if (fieldIndex < 0 || fieldIndex >= singleSeries.fields.length) return [];

  const targetField = singleSeries.fields[fieldIndex];
  if (!targetField?.values) return [];

  // 兼容 Grafana 两种存储格式:buffer / 直接values数组
  const valueList = targetField.values.buffer ?? targetField.values;
  return isSafeArray(valueList) ? valueList : [];
}

// ====================== 业务提取逻辑 ======================
// 1. 根据refId获取目标单系列对象
const targetSeriesItem = getSeriesByRefId(data, "A");

// 2. 按下标分别提取时间、数值
const timeArr = getFieldByIndex(targetSeriesItem, 0);    // fields[0] Time
const valueIntArr = getFieldByIndex(targetSeriesItem, 1); // fields[1] valueInt

console.log("时间数组 Time(fields[0]):", timeArr);
console.log("整型数值 valueInt(fields[1]):", valueIntArr);
三、ECharts 核心配置项
1. title 标题
title: {
  text: 'CPU 使用率',
  subtext: '近1小时',
  left: 'center', // left/right/center/百分比
  top: 10,
  textStyle: { fontSize: 16, color: '#fff' }
}
2. tooltip 提示框(重点!)
tooltip: {
  trigger: 'axis', // axis(坐标轴触发)/ item(图形触发,饼图)
  show: true,
  formatter: '{b}: {c} %', // 自定义格式
  axisPointer: { type: 'cross' } // 十字准星
}
3. legend 图例
legend: {
  data: ['CPU', '内存'], // 对应 series.name
  top: 0,
  textStyle: { color: '#ccc' }
}
4. grid 绘图网格(直角坐标系)
grid: {
  left: '3%', right: '4%', bottom: '3%', top: '15%',
  containLabel: true // 包含坐标轴标签,防止溢出
}
5. xAxis /yAxis 坐标轴
时间轴(最常用)
xAxis: {
  type: 'time', // time / category / value
  axisLabel: {
    formatter: '{HH}:{mm}', // 时间格式化
    color: '#ccc'
  }
}
类目轴(分类)
xAxis: {
  type: 'category',
  data: ['周一','周二','周三']
}
数值轴
yAxis: {
  type: 'value',
  name: '使用率(%)',
  min: 0, max: 100
}
6. series 系列(最重要,决定图表类型)
数组,每个元素对应一条曲线 / 柱 / 饼:
series: [
  {
    name: 'CPU',
    type: 'line', // line/bar/pie/gauge/radar...
    data: [/* 数组:[时间, 值] 或 [值] */],
    smooth: true, // 平滑曲线
    lineStyle: { width: 2 },
    itemStyle: { color: '#ff9800' }
  }
]
7. 其他常用
color: ['#ff9800', '#2196f3']:全局配色backgroundColor: 'transparent':背景(Grafana 面板透明)animation: true:开启动画
8.dataZoom
dataZoom = 区域缩放 + 平移,解决数据太多挤在一起看不清的问题
- inside:纯鼠标 / 手势(滚轮缩放、拖拽平移、框选),无 UI 条
- slider:底部 / 右侧滑块条,可拖动、缩放,有 UI
    dataZoom: [
      {
        type: 'inside',
        xAxisIndex: 0,          // 控制哪个 x 轴(时序固定 0)
        zoomOnMouseWheel: true, //是否滚轮缩放
        moveOnMouseMove: true,   //拖拽平移
        start: 0, end: 100,     // 起止百分比 0–100
        filterMode: 'empty'
      },
      {
        type: 'slider',
        xAxisIndex: 0,
        start: 0, end: 100,
        height: 14,
        bottom: 10,
        backgroundColor: 'rgba(255,255,255,0.1)',
        fillerColor: 'rgba(70,130,180,0.4)',
        handleStyle: { color: '#4682b4' }
      }
    ]
示例:
// ==================== 最终图表配置 ====================
const option = {
  tooltip: {
    trigger: 'axis',
    formatter: params => {
      const i = params?.[0]?.dataIndex;
      if (i == null || !groupAvg[i]) return '无数据';
      // 升级:鼠标悬浮显示【当前配方】
      return `
        当前配方:${groupRecipes[i]}<br/>
        直径均值:${groupAvg[i].toFixed(3)}<br/>
        中心线 CL:${cl.toFixed(3)}<br/>
        上控线 UCL:${ucl.toFixed(3)}<br/>
        下控制线 LCL:${lcl.toFixed(3)}
      `;
    }
  },
  legend: {
    show: true,
    top: 5,
    textStyle: { fontSize: 15, color: '#333' },
    itemWidth: 18,
    itemHeight: 14
  },
  dataZoom: [
    { type: 'inside' },
    { type: 'slider', show: true, bottom: 5 }
  ],
  grid: [
    { left: '3%', right: '3%', top: '8%', height: '55%' },
    { left: '3%', right: '3%', top: '70%', height: '18%' }
  ],
  xAxis: [
    {
      type: 'category',
      data: groupX || [],
      axisLabel: { show: false },
      axisLine: { show: false }
    },
    {
      type: 'category',
      data: groupX || [],
      gridIndex: 1,
      axisLabel: { show: false },
      axisLine: { show: false }
    }
  ],
  yAxis: [
    {
      type: 'value',
      axisLabel: { show: true, fontSize: 11 },
      axisTick: { show: false },
      splitLine: { show: false },
      min: yMin,
      max: yMax
    },
    {
      type: 'value',
      gridIndex: 1,
      axisLabel: { show: false },
      axisTick: { show: false },
      splitLine: { show: false }
    }
  ],
  series: [
    {
      name: '直径组均值',
      type: 'line',
      data: groupAvg || [],
      itemStyle: { color: '#FFC107' },
      lineStyle: { color: '#FFC107', width: 2 },
      symbolSize: 10,
      markLine: {
        animation: false,
        data: recipeMarkLines
      }
    },
    {
      name: '中心线 CL',
      type: 'line',
      data: groupX.map(() => cl) || [],
      lineStyle: { color: '#00B42A', width: 3 },
      symbol: 'none'
    },
    {
      name: '上控制线 UCL',
      type: 'line',
      data: groupX.map(() => ucl) || [],
      lineStyle: { color: '#1890FF', type: 'dashed', width: 2 },
      symbol: 'none'
    },
    {
      name: '下控制线 LCL',
      type: 'line',
      data: groupX.map(() => lcl) || [],
      lineStyle: { color: '#333', type: 'dashed', width: 2 },
      symbol: 'none'
    }
  ]
};

return option;

汇聚全球AI编程工具,助力开发者即刻编程。
更多推荐
 6
6 0
0- 0


 已为社区贡献5条内容

所有评论(0)