
Prometheus 全方位监控实战(五)Node Exporter黑白名单与Prometheus高级特性
·
内容概览
| 模块 | 核心内容 |
|---|---|
| 01 Node Exporter黑白名单 | 客户端限制、服务端限制、采集器过滤 |
| 02 Prometheus存储 | 本地存储参数、VictoriaMetrics远端存储 |
| 03 标签管理 | relabel_configs、metric_relabel_configs、自定义标签 |
| 04 Blackbox Exporter | 黑盒监控、HTTP/ICMP/TCP探测 |
| 05 Grafana存储 | MySQL替换SQLite作为元数据存储 |
一、Node Exporter启用黑白名单
1.1 黑白名单的限制策略
黑白名单主要针对是否采集目标数据,我们可以从客户端(Exporters)或者服务端进行限制。
| 策略 | 说明 |
|---|---|
| 黑名单 | 哪些资源不采集 |
| 白名单 | 只采集哪些资源 |
1.2 Node Exporter实现黑白名单
参考链接:https://github.com/prometheus/node_exporter
# 1. 停止服务
[root@node-exporter41 ~]# systemctl stop node-exporter.service

# 2. 进入node_exporter目录
[root@node-exporter41 ~]# cd /oldboyedu/softwares/node_exporter-1.9.1.linux-amd64/

# 3. 配置黑名单(不采集CPU相关指标)
[root@node-exporter41 node_exporter-1.9.1.linux-amd64]# ./node_exporter --no-collector.cpu

# 4. 配置白名单(只采集cpu、uname、diskstats指标)
[root@node-exporter41 node_exporter-1.9.1.linux-amd64]# ./node_exporter --collector.disable-defaults --collector.cpu --collector.uname --collector.diskstats
测试指标对应关系
| 采集器 | 相关指标 |
|---|---|
--collector.cpu |
node_cpu_seconds_total |
--collector.uname |
node_uname_info |
--collector.diskstats |
node_disk_io_now |
1.3 Prometheus Server实现黑白名单
黑名单配置
[root@prometheus-server31 ~]# systemctl stop prometheus-server.service
[root@prometheus-server31 ~]# cd /oldboyedu/softwares/prometheus-2.53.4.linux-amd64/
[root@prometheus-server31 prometheus-2.53.4.linux-amd64]# vim prometheus.yml
- job_name: "k8s_exporter"
  params:
    exclude[]:
      - cpu
  static_configs:
    - targets: ["10.0.0.42:9100"]
# 检查配置文件
[root@prometheus-server31 prometheus-2.53.4.linux-amd64]# ./promtool check config ./prometheus.yml
Checking ./prometheus.yml
 SUCCESS: ./prometheus.yml is valid prometheus config file syntax

# 热加载配置
# -k -u k8s:yinzhengjie  没配置https不用加这个
[root@prometheus-server31 prometheus-2.53.4.linux-amd64]# curl -k -u k8s:yinzhengjie -X POST https://10.0.0.31:9090/-/reload

# 验证(应该查不到cpu指标)https://10.0.0.31:9090
node_cpu_seconds_total{job="k8s_exporter"}
白名单配置
[root@prometheus-server31 prometheus-2.53.4.linux-amd64]# vim prometheus.yml
- job_name: "dba_exporter"
  params:
    collect[]:
      - uname
      - diskstats
  static_configs:
    - targets: ["10.0.0.41:9100"]
# 热加载配置
[root@prometheus-server31 prometheus-2.53.4.linux-amd64]# ./promtool check config ./prometheus.yml
Checking ./prometheus.yml
 SUCCESS: ./prometheus.yml is valid prometheus config file syntax

[root@prometheus-server31 prometheus-2.53.4.linux-amd64]# curl -k -u k8s:yinzhengjie -X POST https://10.0.0.31:9090/-/reload

# 验证(应该能查到uname和diskstats指标)
node_uname_info{job="dba_exporter"}
node_disk_io_now{job="dba_exporter"}
长期生效配置
# 修改启动文件内容
systemctl cat prometheus-server.service
二、Prometheus的存储实战
2.1 Prometheus本地存储相关参数说明
# 查看启动参数
[root@prometheus-server31 ~]# systemctl cat prometheus-server.service
相关参数说明
| 参数 | 说明 |
|---|---|
--web.config.file |
指定web配置文件,如开启https证书、认证信息等 |
--web.enable-lifecycle |
支持热加载模块,可使用curl热加载,无需重启 |
--storage.tsdb.path |
指定数据存储路径 |
--storage.tsdb.retention.time |
指定数据存储周期 |
--web.listen-address |
配置监听地址 |
--web.max-connections |
配置最大连接数 |
--config.file |
指定Prometheus配置文件 |
# 更多参数查看
[root@prometheus-server31 prometheus-2.53.4.linux-amd64]# ./prometheus -h
查看目录结构
[root@prometheus-server31 prometheus-2.53.4.linux-amd64]# ll /oldboyedu/data/prometheus
total 48
drwxr-xr-x 7 root root  4096 May 22 08:52 ./
drwxr-xr-x 3 root root  4096 May 19 10:34 ../
drwxr-xr-x 3 root root  4096 May 21 17:00 01KS4W6QWA4VAHKKFBW7W8X862/  # TSDB数据块
drwxr-xr-x 3 root root  4096 May 22 08:51 01KS6JNTD30XQ70MJ6725ERPBD/
drwxr-xr-x 3 root root  4096 May 22 08:52 01KS6JNTT20WV9FP945BV8SZ01/
drwxr-xr-x 2 root root  4096 May 22 08:58 chunks_head/  # 正在写入的最新数据块,不能删除
-rw-r--r-- 1 root root     0 May 22 08:51 lock  # 防止多个Prometheus进程同时操作同一份数据
-rw-r--r-- 1 root root 20001 May 22 09:22 queries.active  # 记录当前正在执行的PromQL查询
drwxr-xr-x 3 root root  4096 May 22 08:51 wal/  # Write Ahead Log(预写日志)
# 查看数据块内部结构
[root@prometheus-server31 prometheus-2.53.4.linux-amd64]# ll /oldboyedu/data/prometheus/01KS4W6QWA4VAHKKFBW7W8X862/
total 1080
drwxr-xr-x 3 root root    4096 May 21 17:00 ./
drwxr-xr-x 7 root root    4096 May 22 08:52 ../
drwxr-xr-x 2 root root    4096 May 21 17:00 chunks/  # 存放时序指标原始采样数据
-rw-r--r-- 1 root root 1082939 May 21 17:00 index  # 索引文件,加速PromQL查询
-rw-r--r-- 1 root root     279 May 21 17:00 meta.json  # 数据块元信息
-rw-r--r-- 1 root root       9 May 21 17:00 tombstones  # 标记已删除的时序数据墓碑记录
2.2 VictoriaMetrics单机版快速部署
VictoriaMetrics概述
VictoriaMetrics是一个快速、经济高效且可扩展的监控解决方案和时间序列数据库。
| 链接 | 地址 |
|---|---|
| 官网 | https://victoriametrics.com/ |
| 官方文档 | https://docs.victoriametrics.com/ |
| GitHub | https://github.com/VictoriaMetrics/VictoriaMetrics |
| 部署文档 | https://docs.victoriametrics.com/quick-start/ |
温馨提示:版本选择建议使用93 LTS,因为97 LTS需要企业授权。
部署VictoriaMetrics单机版
# 1. 下载victoriametrics
wget https://github.com/VictoriaMetrics/VictoriaMetrics/releases/download/v1.93.16/victoria-metrics-linux-amd64-v1.93.16.tar.gz

# 2. 解压软件包
[root@node-exporter43 ~]# tar xf victoria-metrics-linux-amd64-v1.93.16.tar.gz -C /usr/local/bin/
[root@node-exporter43 ~]# ll /usr/local/bin/victoria-metrics-prod
-rwxr-xr-x 1 yinzhengjie yinzhengjie 22216200 Jul 18  2024 /usr/local/bin/victoria-metrics-prod*

# 3. 编写启动脚本
[root@node-exporter43 ~]# cat > /etc/systemd/system/victoria-metrics.service <<EOF
[Unit]
Description=Linux VictoriaMetrics Server
Documentation=https://docs.victoriametrics.com/
After=network.target

[Service]
ExecStart=/usr/local/bin/victoria-metrics-prod \
   -httpListenAddr=0.0.0.0:8428 \
   -storageDataPath=/oldboyedu/data/victoria-metrics \
   -retentionPeriod=3

[Install]
WantedBy=multi-user.target
EOF

# 4. 启动服务
[root@node-exporter43 ~]# systemctl daemon-reload
[root@node-exporter43 ~]# systemctl enable --now victoria-metrics.service
[root@node-exporter43 ~]# systemctl status victoria-metrics

# 5. 检查端口
[root@node-exporter43 ~]# ss -ntl | grep 8428
LISTEN 0      4096         0.0.0.0:8428      0.0.0.0:*

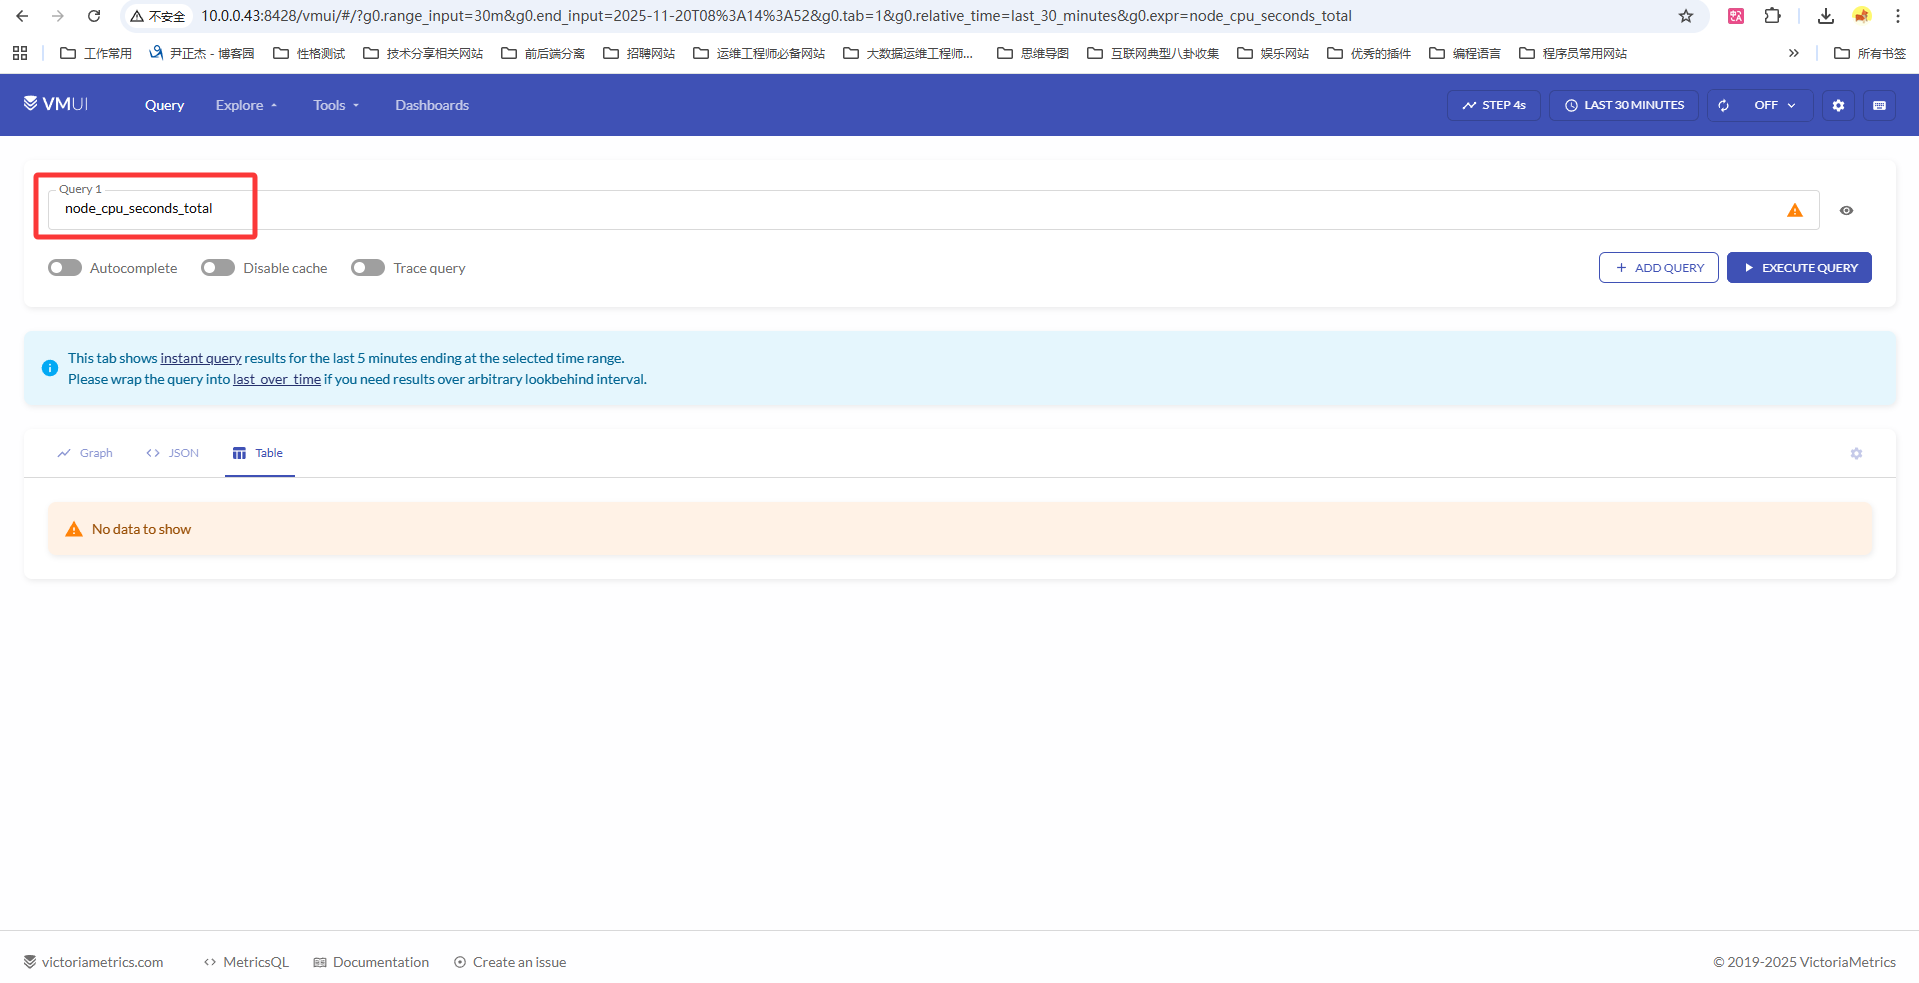
# 6. 查看WebUI
http://10.0.0.43:8428/
2.3 Prometheus配置VictoriaMetrics远端存储
# 1. 修改prometheus的配置文件
[root@prometheus-server31 ~]# vim /oldboyedu/softwares/prometheus-2.53.4.linux-amd64/prometheus.yml
# 在顶级字段中配置VictoriaMetrics地址
remote_write:
  - url: http://10.0.0.43:8428/api/v1/write

scrape_configs:
  - job_name: "linux-VictoriaMetrics-node-exporter"
    static_configs:
      - targets:
          - "10.0.0.41:9100"
          - "10.0.0.42:9100"
          - "10.0.0.43:9100"
# 2. 重新加载prometheus的配置
[root@prometheus-server31 prometheus-2.53.4.linux-amd64]# systemctl stop prometheus-server.service
[root@prometheus-server31 prometheus-2.53.4.linux-amd64]# ./prometheus
...
ts=2025-09-09T03:39:02.703Z caller=dedupe.go:112 component=remote level=info remote_name=1329bc url=http://10.0.0.43:8428/api/v1/write msg="Starting WAL watcher" queue=1329bc
ts=2025-09-09T03:39:02.704Z caller=dedupe.go:112 component=remote level=info remote_name=1329bc url=http://10.0.0.43:8428/api/v1/write msg="Starting scraped metadata watcher"

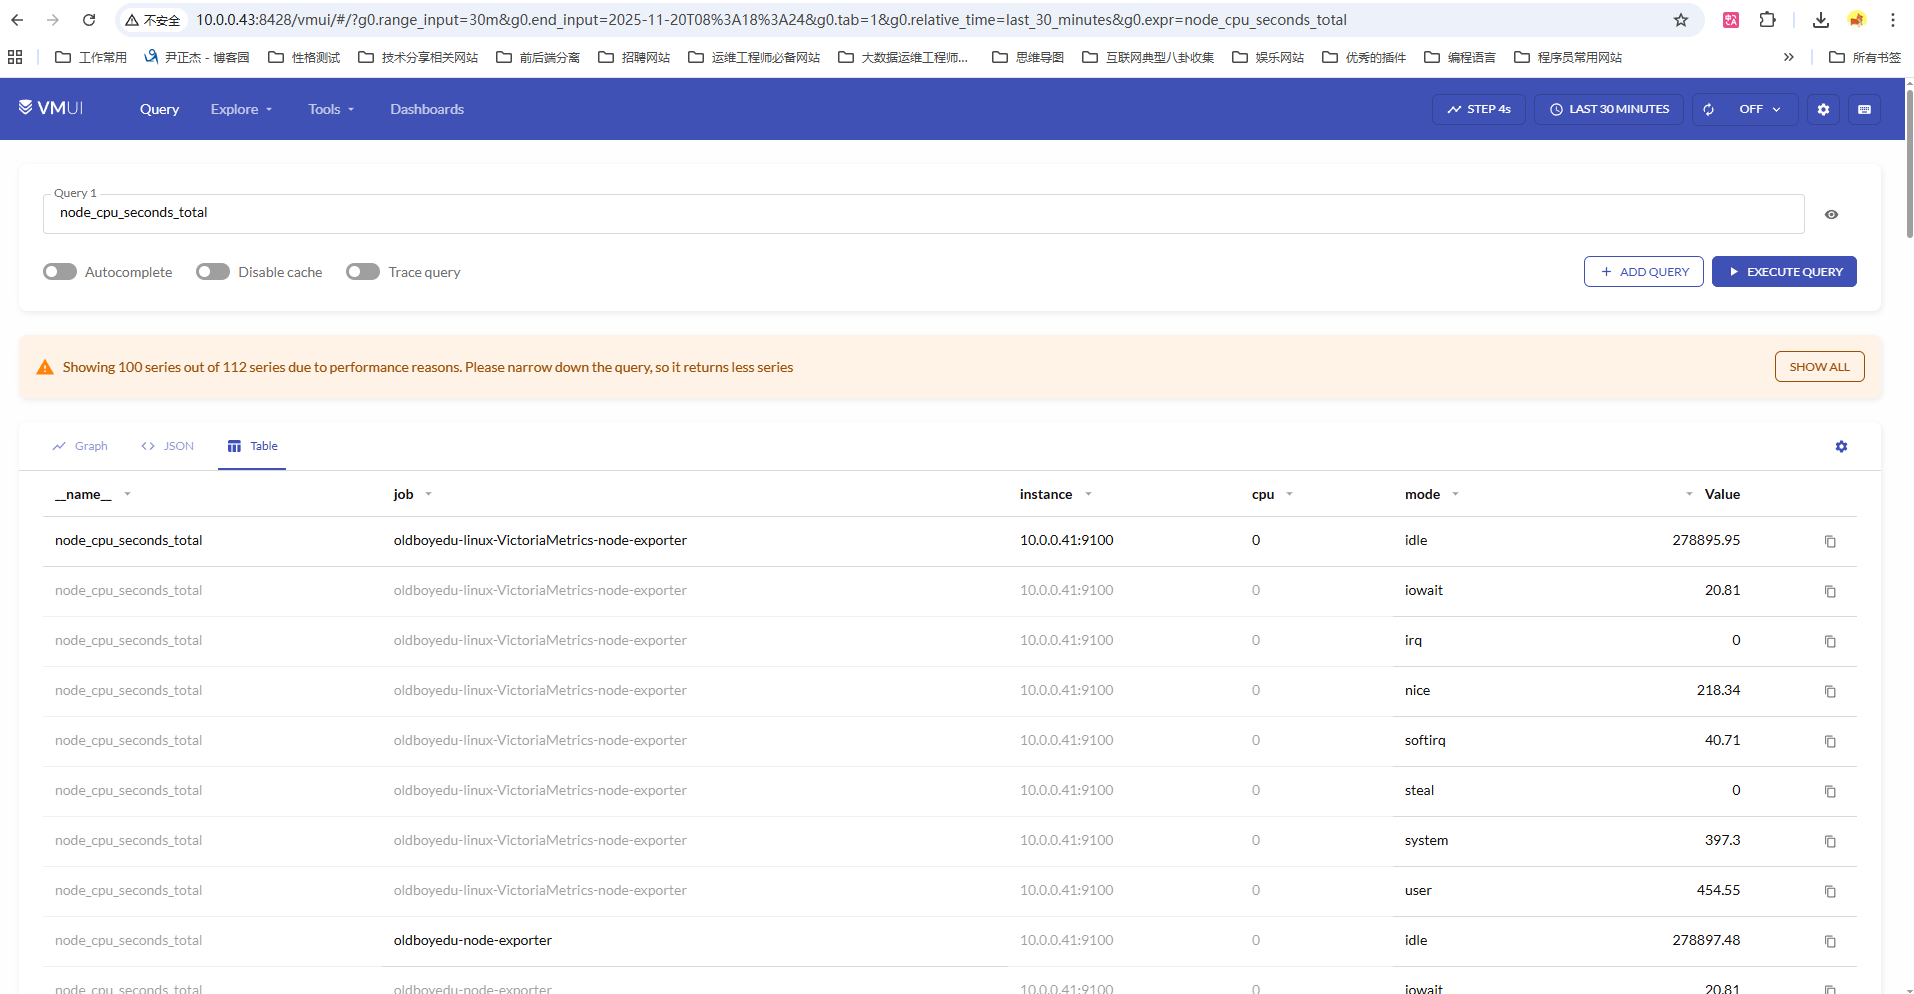
# 3. 在VictoriaMetrics的WebUI查看数据
# 查询示例:
node_cpu_guest_seconds_total{mode="nice"}[20s]
node_load15

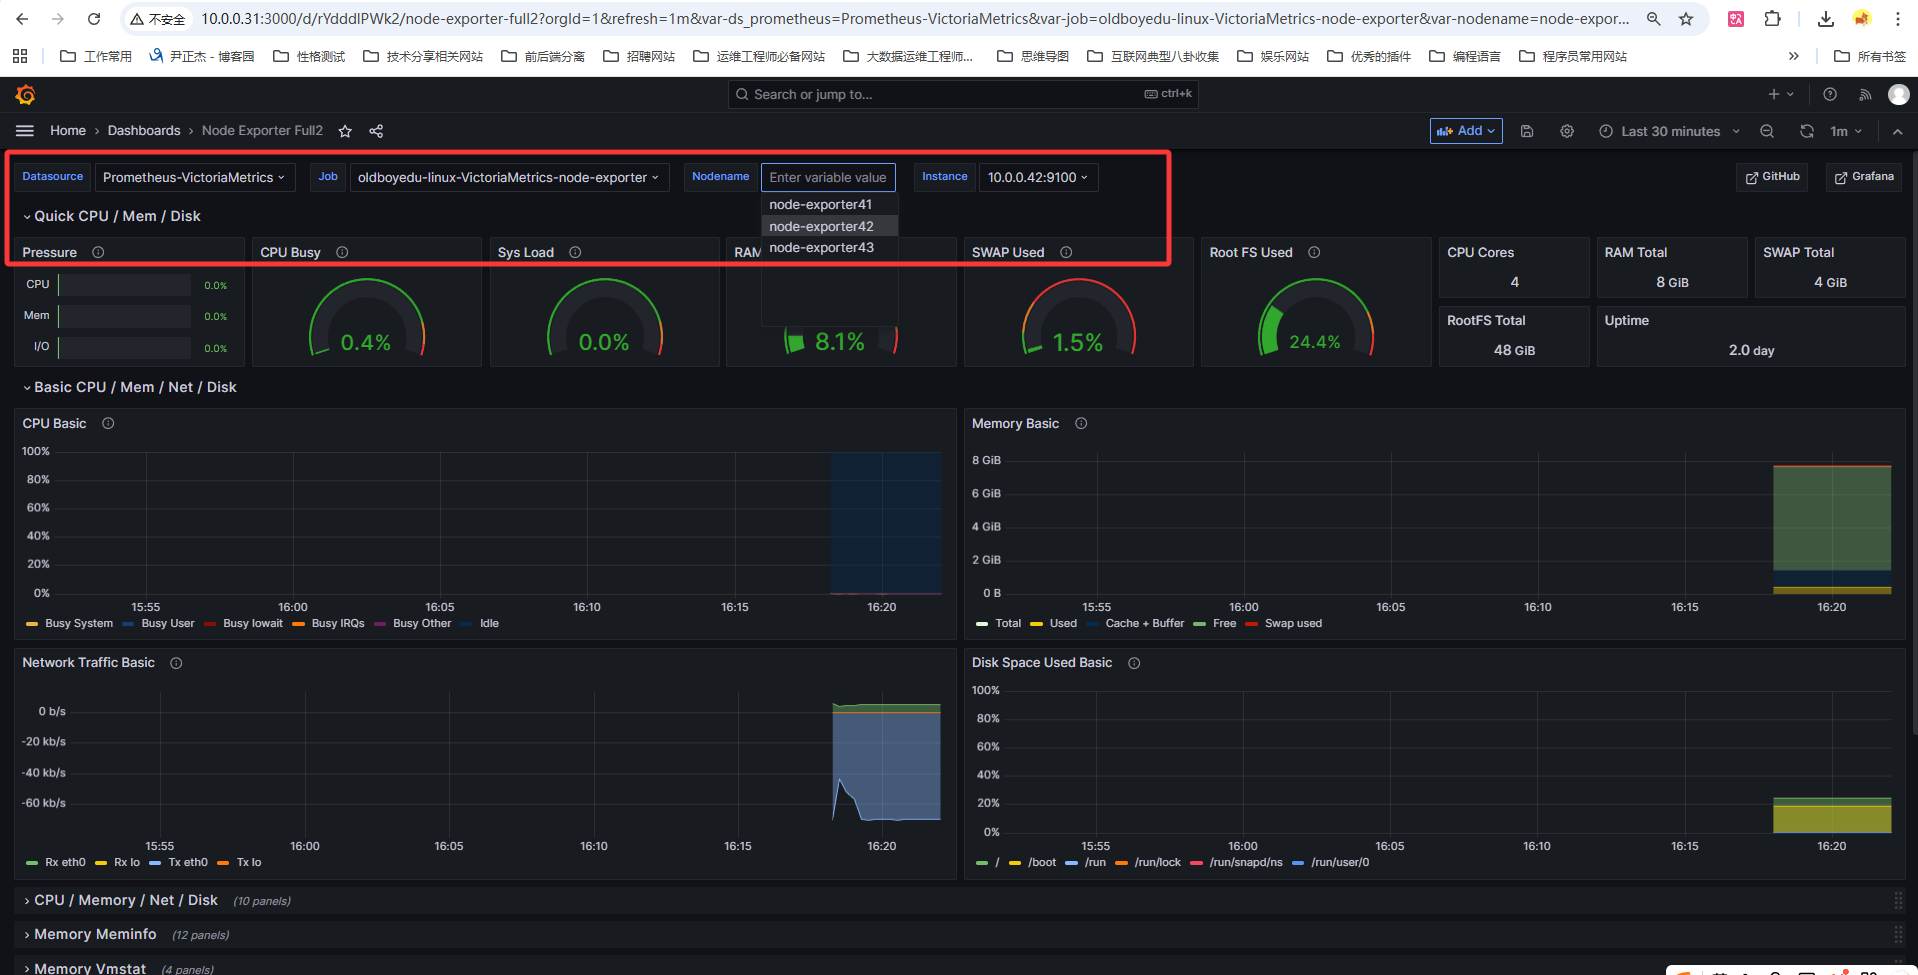
# 4. 配置grafana的数据源
# 数据源类型:Prometheus
# URL:http://10.0.0.43:8428

# 5. 导入grafana的模板ID并选择数据源
# Dashboard ID:1860
三、Prometheus标签管理
3.1 什么是标签
标签用于对数据分组和分类,利用标签可以将数据进行过滤筛选。
标签管理的常见场景
| 场景 | 说明 |
|---|---|
| 删除不必要的指标 | 减少存储压力 |
| 从指标中删除敏感或不需要的标签 | 安全合规 |
| 添加、编辑或修改指标的标签值或标签格式 | 统一规范 |
标签分类
| 分类 | 说明 | 示例 |
|---|---|---|
| 默认标签 | Prometheus自身内置的标签 | __address__、__scheme__、__metrics_path__、instance、job |
| 应用标签 | 应用本身内置的标签 | __meta_consul_address、__meta_consul_dc |
| 自定义标签 | 用户自定义的标签 | 在targets中自定义 |
3.2 标签的两种表现形式
| 类型 | 特点 | 示例 |
|---|---|---|
| 私有标签 | 以__*样式存在,用于获取监控目标的默认元数据属性 |
__scheme__、__address__、__metrics_path__ |
| 普通标签 | 对监控指标进行各种灵活管理操作 | 自定义的业务标签 |
3.3 Prometheus对数据处理的流程
1. 服务发现
   ↓
2. 配置(加载__scheme__、__address__、__metrics_path__等信息)
   ↓
3. 重新标记(relabel_configs)—— 针对要监控的target的标签
   ↓
4. 抓取数据
   ↓
5. 重新标记(metric_relabel_configs)—— 针对已抓取回来的metrics的标签
3.4 为Targets自定义打标签案例
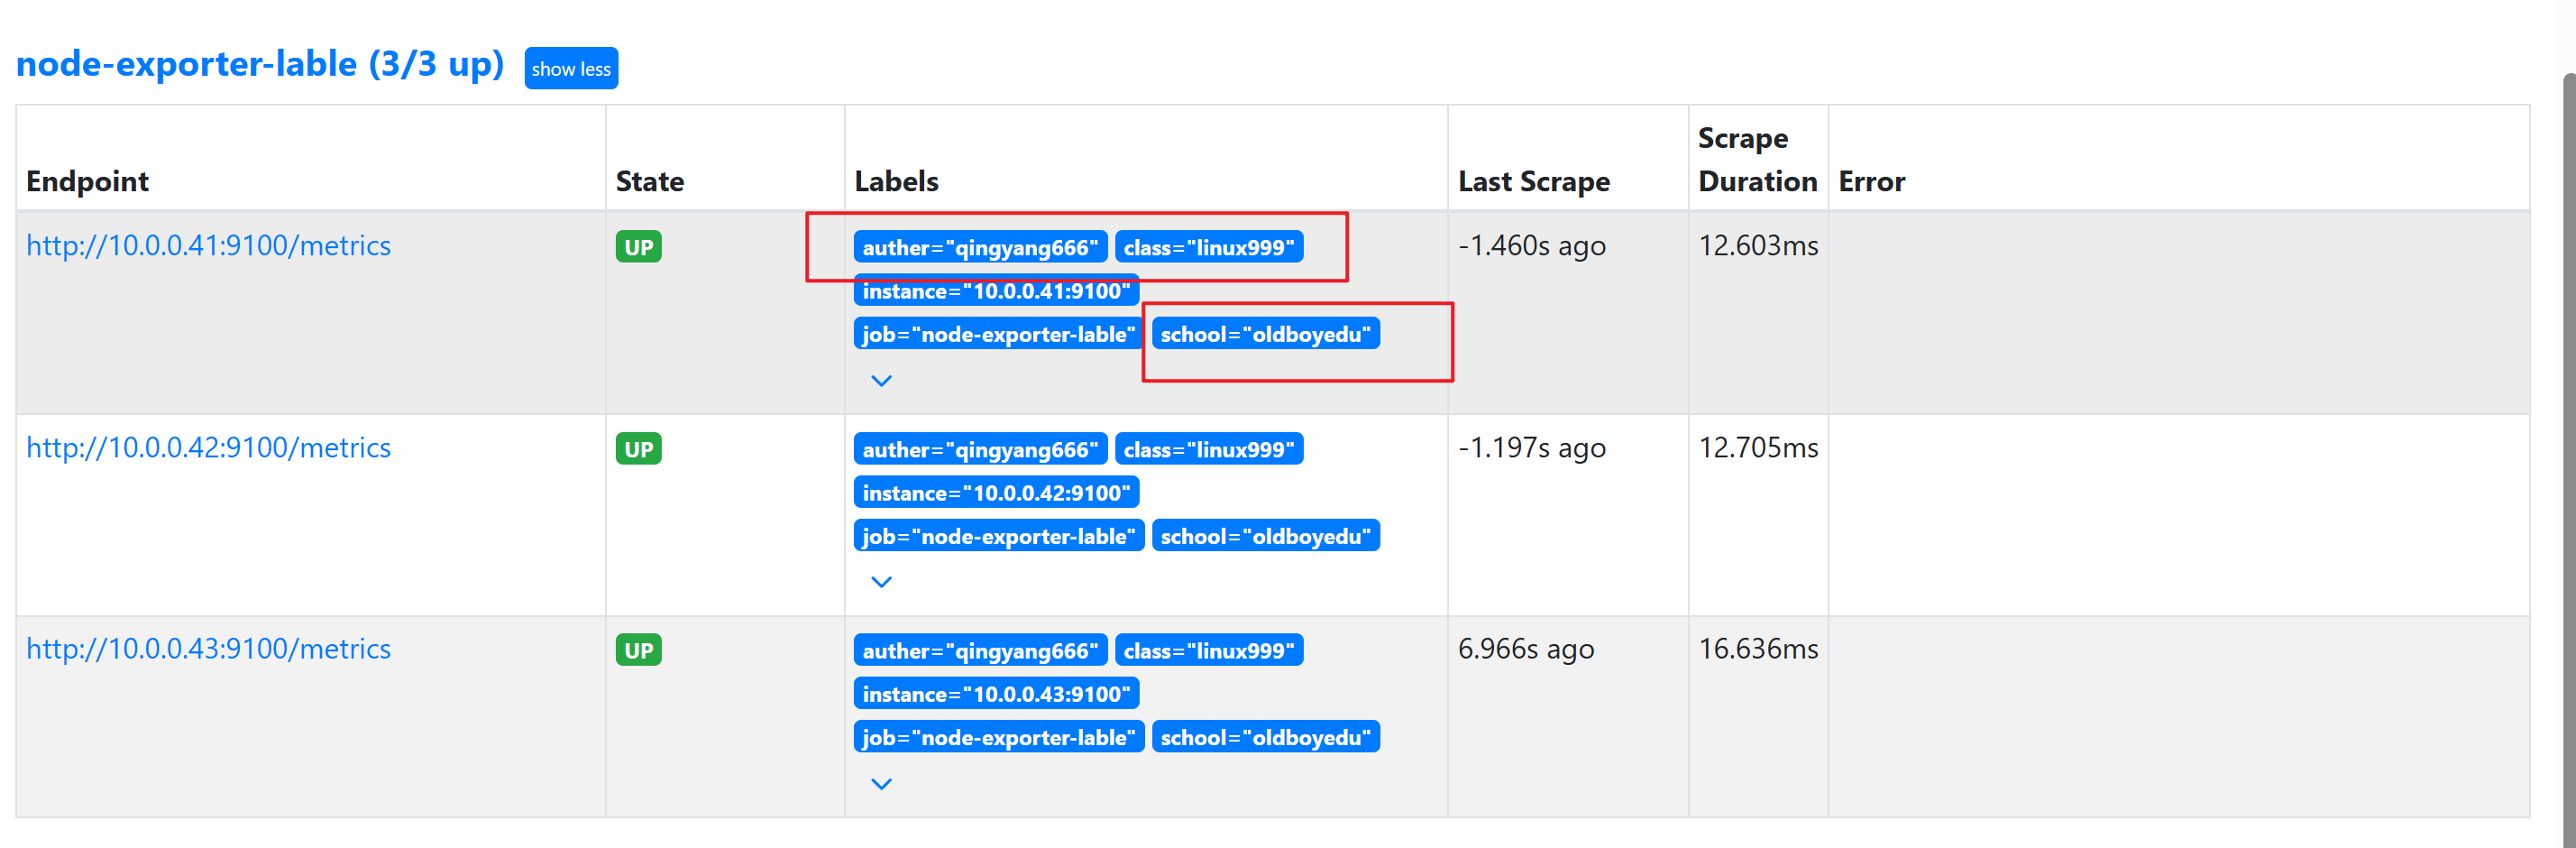
# 1. 修改配置文件
[root@prometheus-server31 prometheus-2.53.4.linux-amd64]# vim prometheus.yml
  - job_name: "node-exporter-lable"
    static_configs:
      - targets: ["10.0.0.41:9100","10.0.0.42:9100","10.0.0.43:9100"]
        labels:
          auther: qingyang666
          school: oldboyedu
          class: linux999
# 2. 检查配置文件及热加载
[root@prometheus-server31 prometheus-2.53.4.linux-amd64]# ./promtool check config ./prometheus.yml
Checking ./prometheus.yml
 SUCCESS: ./prometheus.yml is valid prometheus config file syntax

[root@prometheus-server31 prometheus-2.53.4.linux-amd64]# curl -k -u k8s:yinzhengjie -X POST https://10.0.0.31:9090/-/reload
3.5 relabel_configs替换标签replace案例
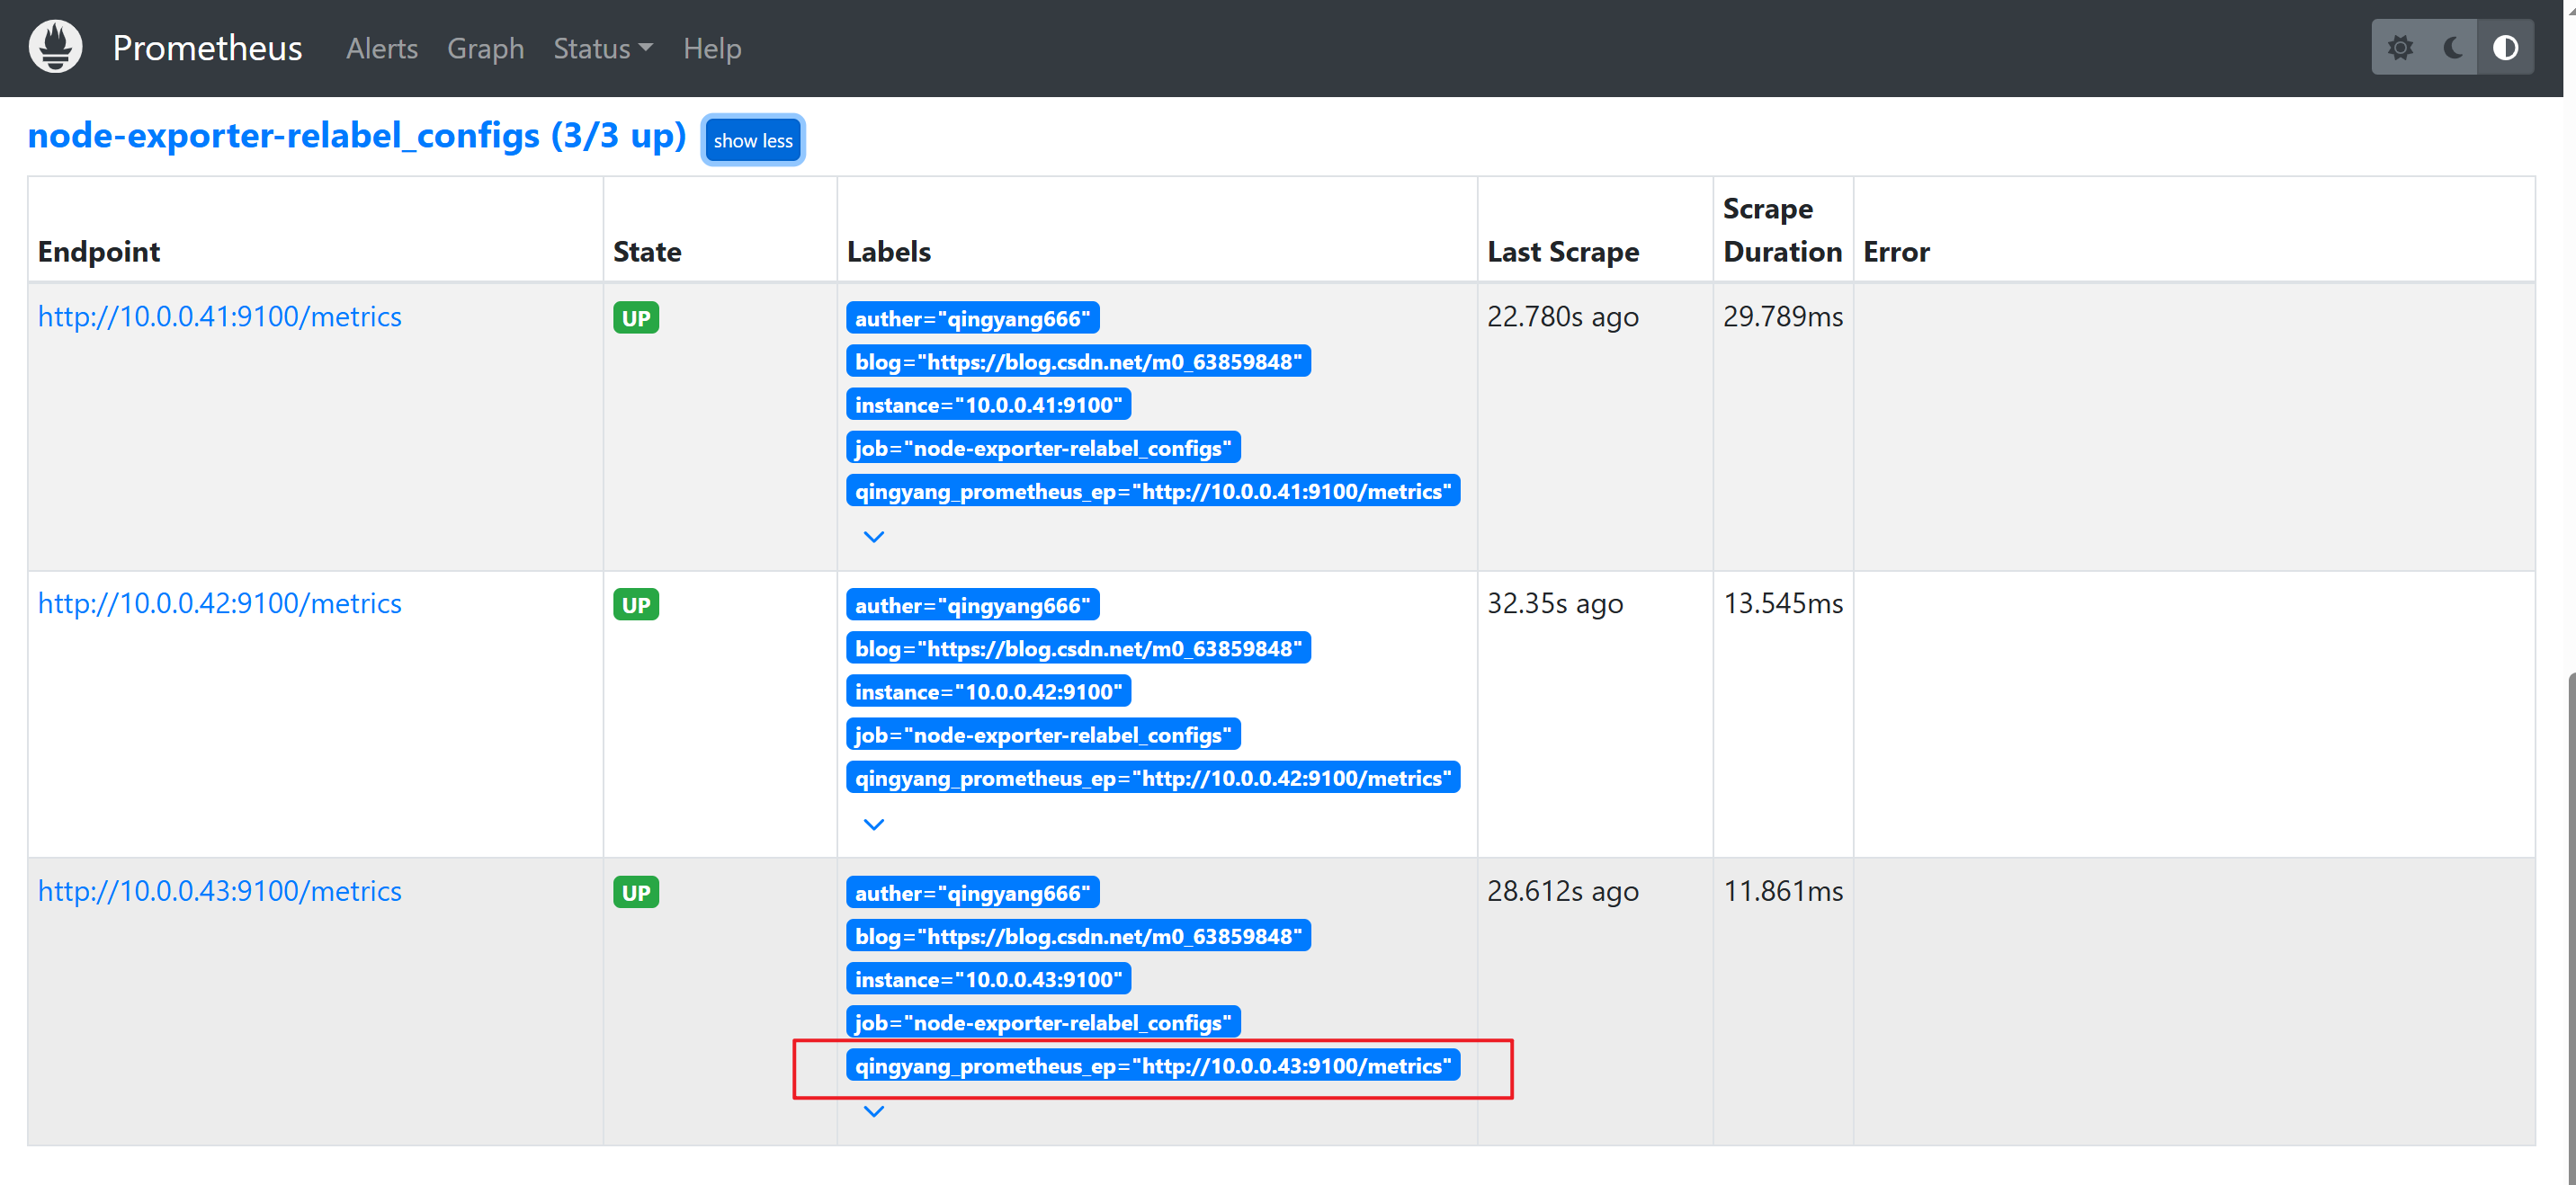
# 1. 修改prometheus的配置文件
[root@prometheus-server31 prometheus-2.53.4.linux-amd64]# vim prometheus.yml
  - job_name: "node-exporter-relabel_configs"
    static_configs:
      - targets: ["10.0.0.41:9100","10.0.0.42:9100","10.0.0.43:9100"]
        labels:
          auther: qingyang666
          blog: https://blog.csdn.net/m0_63859848
    relabel_configs:
      # 指定正则表达式匹配成功的label进行标签管理的列表
    - source_labels:
      - __scheme__
      - __address__
      - __metrics_path__
      # 表示source_labels对应Label的名称或值进行匹配此处指定的正则表达式。
      # 此处我们对数据进行了分组,后面replacement会使用"${1}"和"$2"进行引用。
      regex: "(http|https)(.*)"
      # 指定用于连接多个source_labels为一个字符串的分隔符,若不指定,默认为分号";"。
      # 假设源数据如下:
      # 	__address__="10.0.0.31:9100"
      #		__metrics_path__="/metrics"
      #		__scheme__="http"
      # 拼接后操作的结果为: "http10.0.0.31:9100/metrics"
      separator: ""
      # 在进行Label替换的时候,可以将原来的source_labels替换为指定修改后的label。
      # 将来会新加一个标签,标签的名称为"qingyang_prometheus_ep",值为replacement的数据。
      target_label: "qingyang_prometheus_ep"
      # 替换标签时,将target_label对应的值进行修改成此处的值
      replacement: "${1}://${2}"
      # 对Label或指标进行管理,场景的动作有replace|keep|drop|lablemap|labeldrop等,默认为replace。
      action: replace
# 2. 热加载配置
[root@prometheus-server31 prometheus-2.53.4.linux-amd64]# ./promtool check config ./prometheus.yml
Checking ./prometheus.yml
 SUCCESS: ./prometheus.yml is valid prometheus config file syntax

[root@prometheus-server31 prometheus-2.53.4.linux-amd64]# curl -k -u k8s:yinzhengjie -X POST https://10.0.0.31:9090/-/reload
总结:relabel_configs和labels的作用类似,都是为实例打标签,但relabel_configs的功能性更强,可以基于标签对监控指标进行过滤。
3.6 relabel_configs新增标签映射labelmap及labeldrop案例
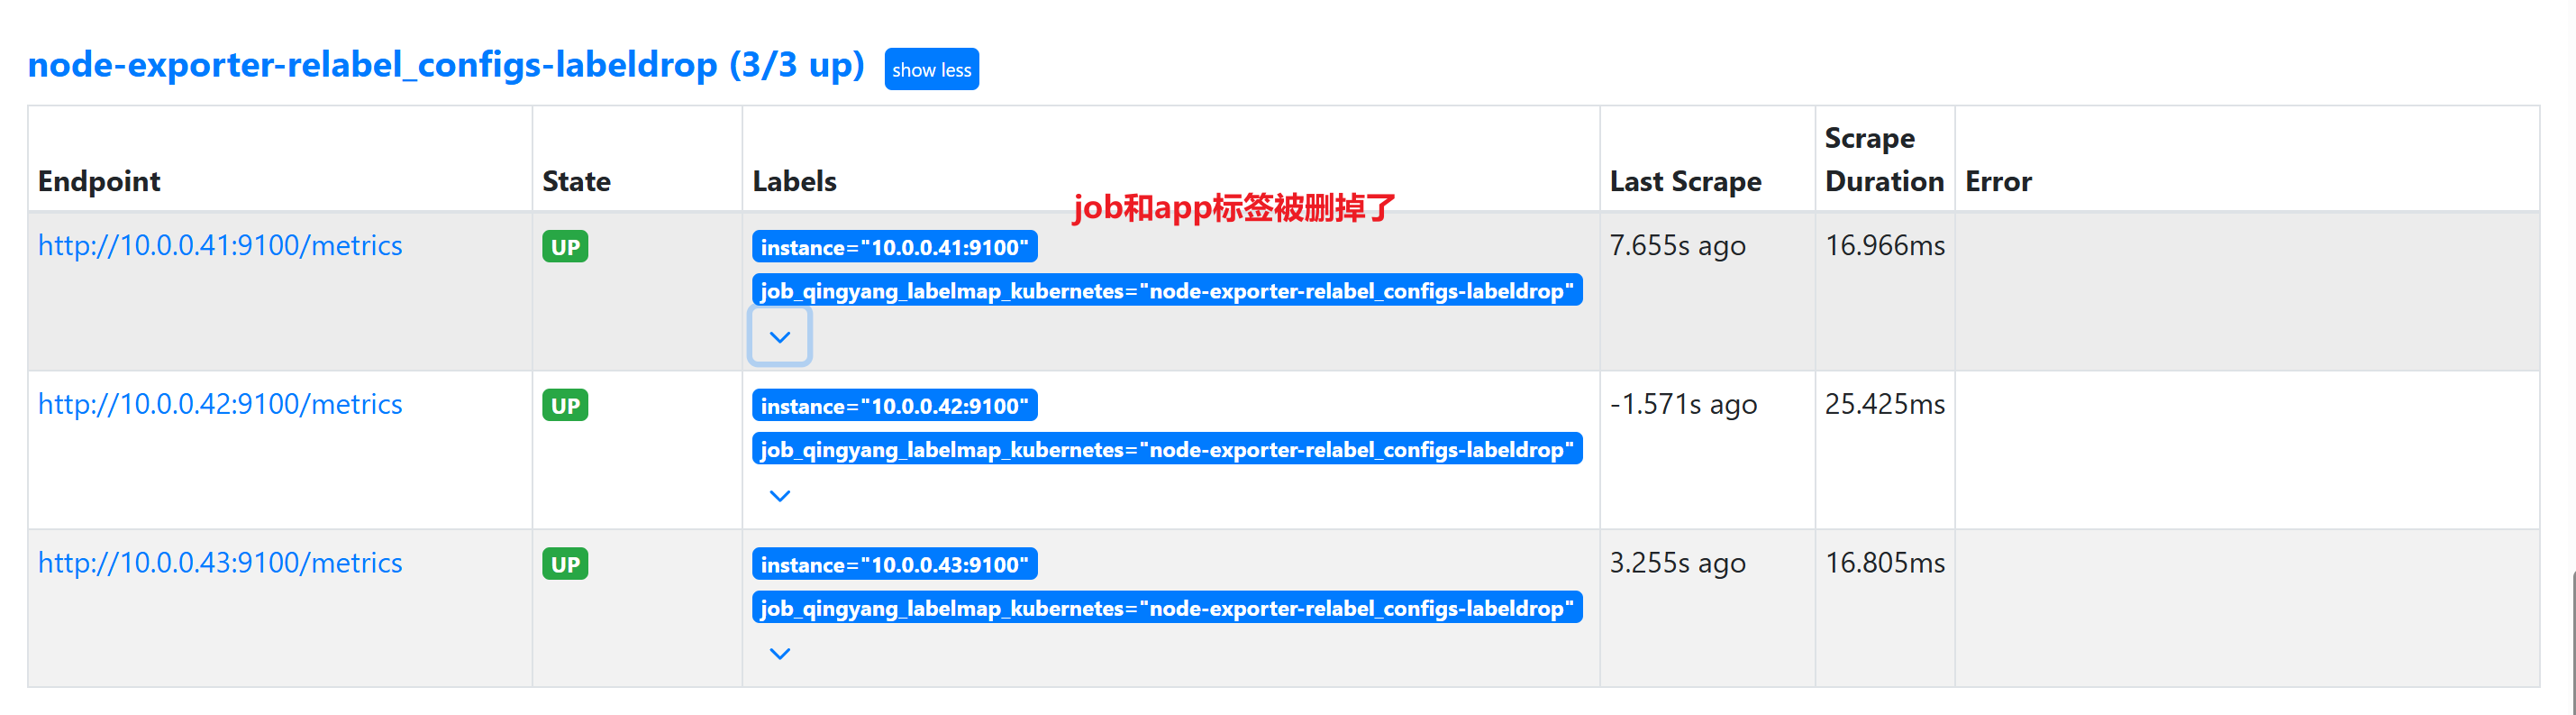
# 1. 修改prometheus的配置文件
[root@prometheus-server31 prometheus-2.53.4.linux-amd64]# vim prometheus.yml
  - job_name: "node-exporter-relabel_configs-labeldrop"
    static_configs:
      - targets: ["10.0.0.41:9100","10.0.0.42:9100","10.0.0.43:9100"]
    relabel_configs:
    - regex: "(job|app)"
      replacement: "${1}_qingyang_labelmap_kubernetes"
      action: labelmap
    - regex: "(job|app)"
      # 删除regex匹配到的标签
      action: labeldrop
# 2. 热加载配置
[root@prometheus-server31 prometheus-2.53.4.linux-amd64]# ./promtool check config ./prometheus.yml
Checking ./prometheus.yml
 SUCCESS: prometheus.yml is valid prometheus config file syntax

[root@prometheus-server31 prometheus-2.53.4.linux-amd64]# curl -k -u k8s:yinzhengjie -X POST https://10.0.0.31:9090/-/reload
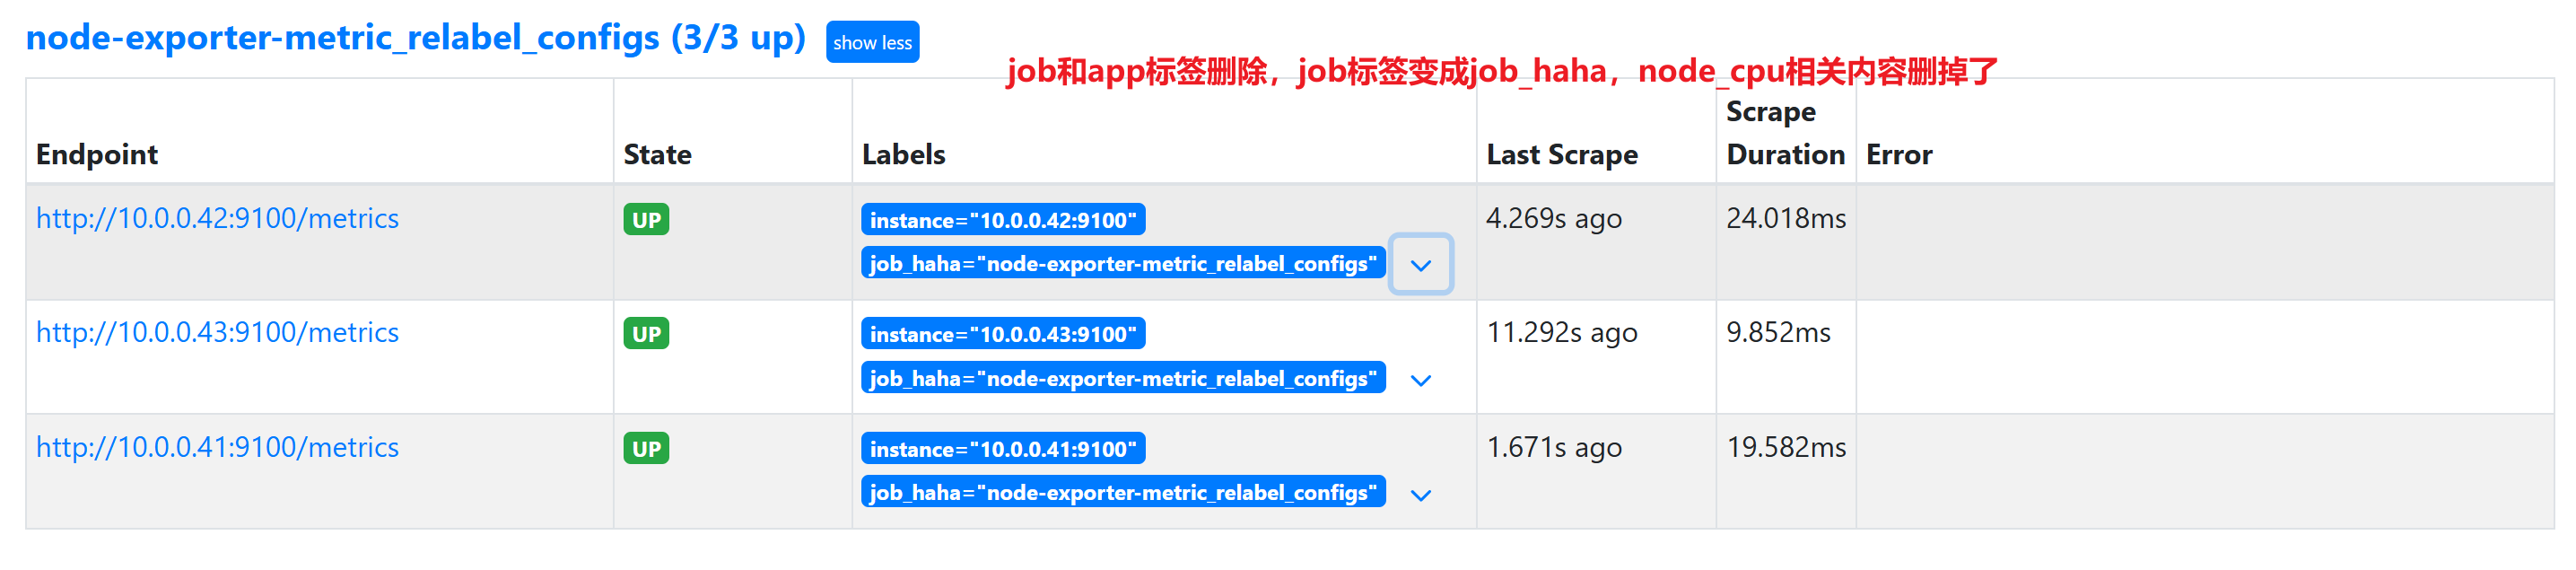
3.7 metric_relabel_configs修改metric标签案例
# 1. 修改prometheus的配置文件
[root@prometheus-server31 prometheus-2.53.4.linux-amd64]# vim prometheus.yml
  - job_name: "node-exporter-metric_relabel_configs"
    static_configs:
      - targets: ["10.0.0.41:9100","10.0.0.42:9100","10.0.0.43:9100"]
    relabel_configs:
    - regex: "(job|app)"
      replacement: "${1}_haha"
      action: labelmap
    - regex: "(job|app)"
      action: labeldrop
    metric_relabel_configs:
    - source_labels:
      - __name__
      regex: "node_cpu_.*"
      action: drop
# 2. 热加载配置
[root@prometheus-server31 prometheus-2.53.4.linux-amd64]# ./promtool check config ./prometheus.yml
Checking ./prometheus.yml
 SUCCESS: prometheus.yml is valid prometheus config file syntax

[root@prometheus-server31 prometheus-2.53.4.linux-amd64]# curl -k -u k8s:yinzhengjie -X POST https://10.0.0.31:9090/-/reload
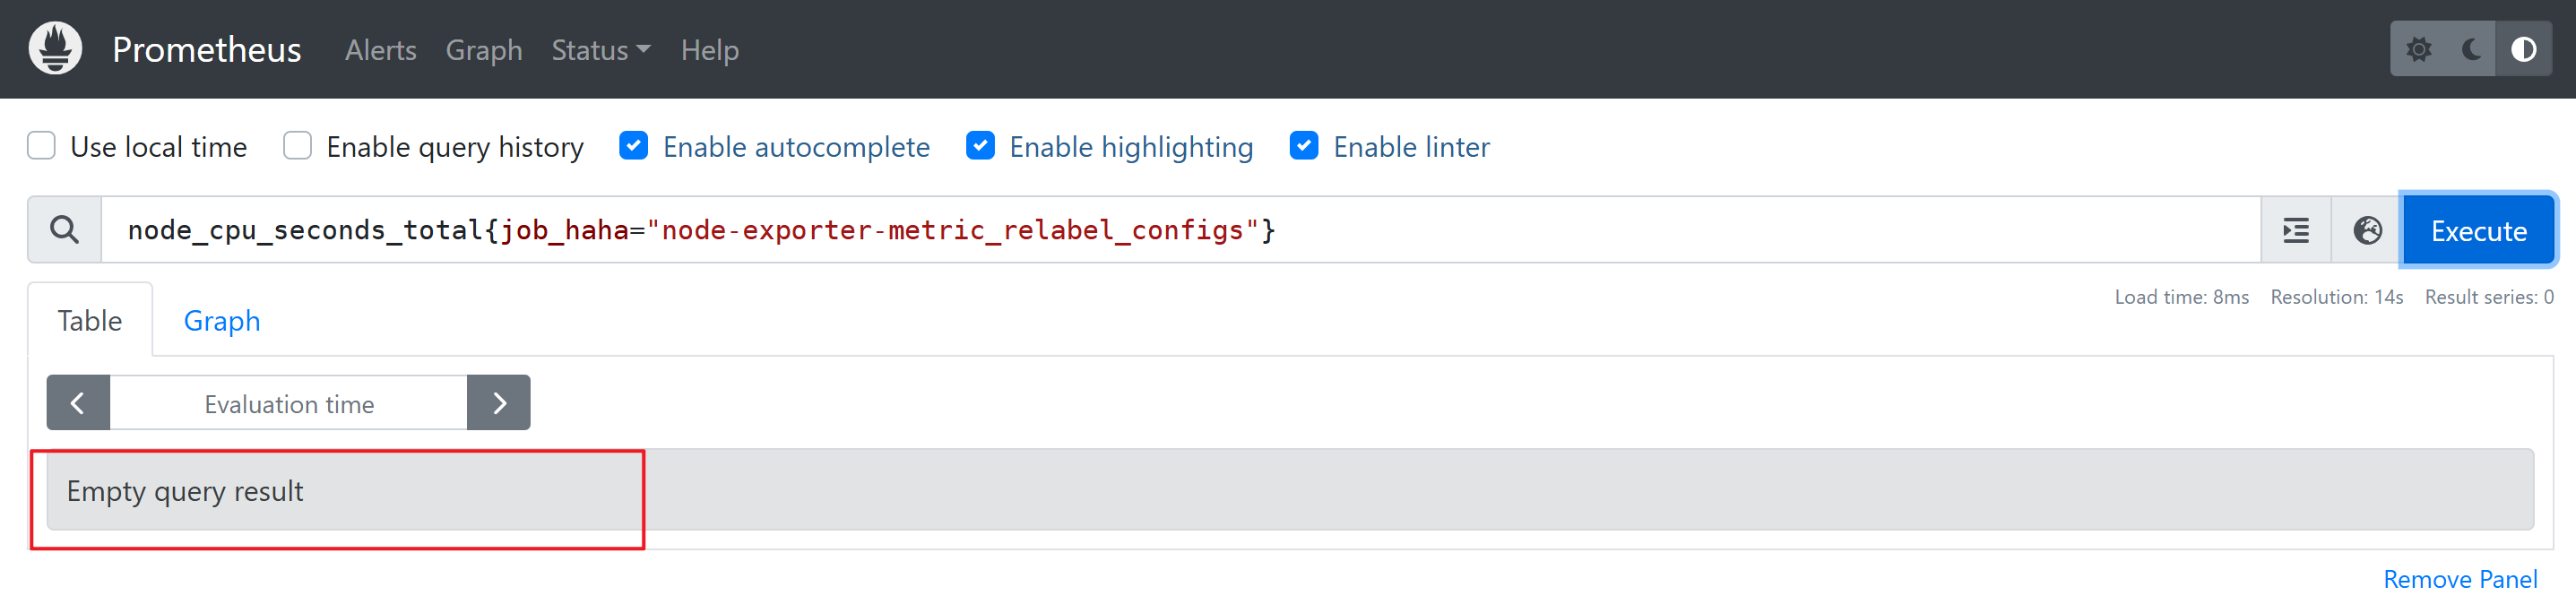
测试语句
# 以下查询查不到数据(因为node_cpu_*指标被丢弃)
node_cpu_seconds_total{job_haha="node-exporter-metric_relabel_configs"}[10s]

# 以下查询可以查到数据
node_load5{job_haha="yinzhengjie-node-exporter-metric_relabel_configs"}[10s]
四、Blackbox Exporter黑盒监控
4.1 Blackbox Exporter概述
Blackbox Exporter一般用于监控网站是否存活、端口是否存活、证书有效期等。支持基于HTTP、HTTPS、DNS、TCP、ICMP、gRPC协议来对目标节点进行监控。
| 协议 | 用途 |
|---|---|
| HTTP/HTTPS | 探测网站返回状态码是否为200 |
| TCP | 探测主机端口是否监听 |
| ICMP | Ping主机连通性 |
| gRPC | 调用接口验证服务是否正常 |
| DNS | 检测域名解析 |
黑盒监控 vs 白盒监控
| 类型 | 说明 | 类比 |
|---|---|---|
| 黑盒监控 | 事件已发生,监控后触发告警 | 车开不动了叫拖车 |
| 白盒监控 | 通过内部监控预测事件,提前告警 | 观察油表提前加油 |
4.2 部署Blackbox Exporter
# 1. 下载blackbox-exporter
wget https://github.com/prometheus/blackbox_exporter/releases/download/v0.28.0/blackbox_exporter-0.28.0.linux-amd64.tar.gz

# 2. 解压软件包
[root@node-exporter43 ~]# tar xf blackbox_exporter-0.28.0.linux-amd64.tar.gz -C /usr/local/
[root@node-exporter43 ~]# cd /usr/local/blackbox_exporter-0.28.0.linux-amd64/
[root@node-exporter43 blackbox_exporter-0.28.0.linux-amd64]# ll
total 33000
drwxr-xr-x  2 1001 1002     4096 Dec  6 21:26 ./
drwxr-xr-x 11 root root     4096 Apr  2 16:44 ../
-rwxr-xr-x  1 1001 1002 33759273 Dec  6 21:24 blackbox_exporter*
-rw-r--r--  1 1001 1002     1659 Dec  6 21:25 blackbox.yml
-rw-r--r--  1 1001 1002    11357 Dec  6 21:25 LICENSE
-rw-r--r--  1 1001 1002       94 Dec  6 21:25 NOTICE

# 3. 启动blackbox服务
[root@node-exporter43 blackbox_exporter-0.28.0.linux-amd64]# ./blackbox_exporter

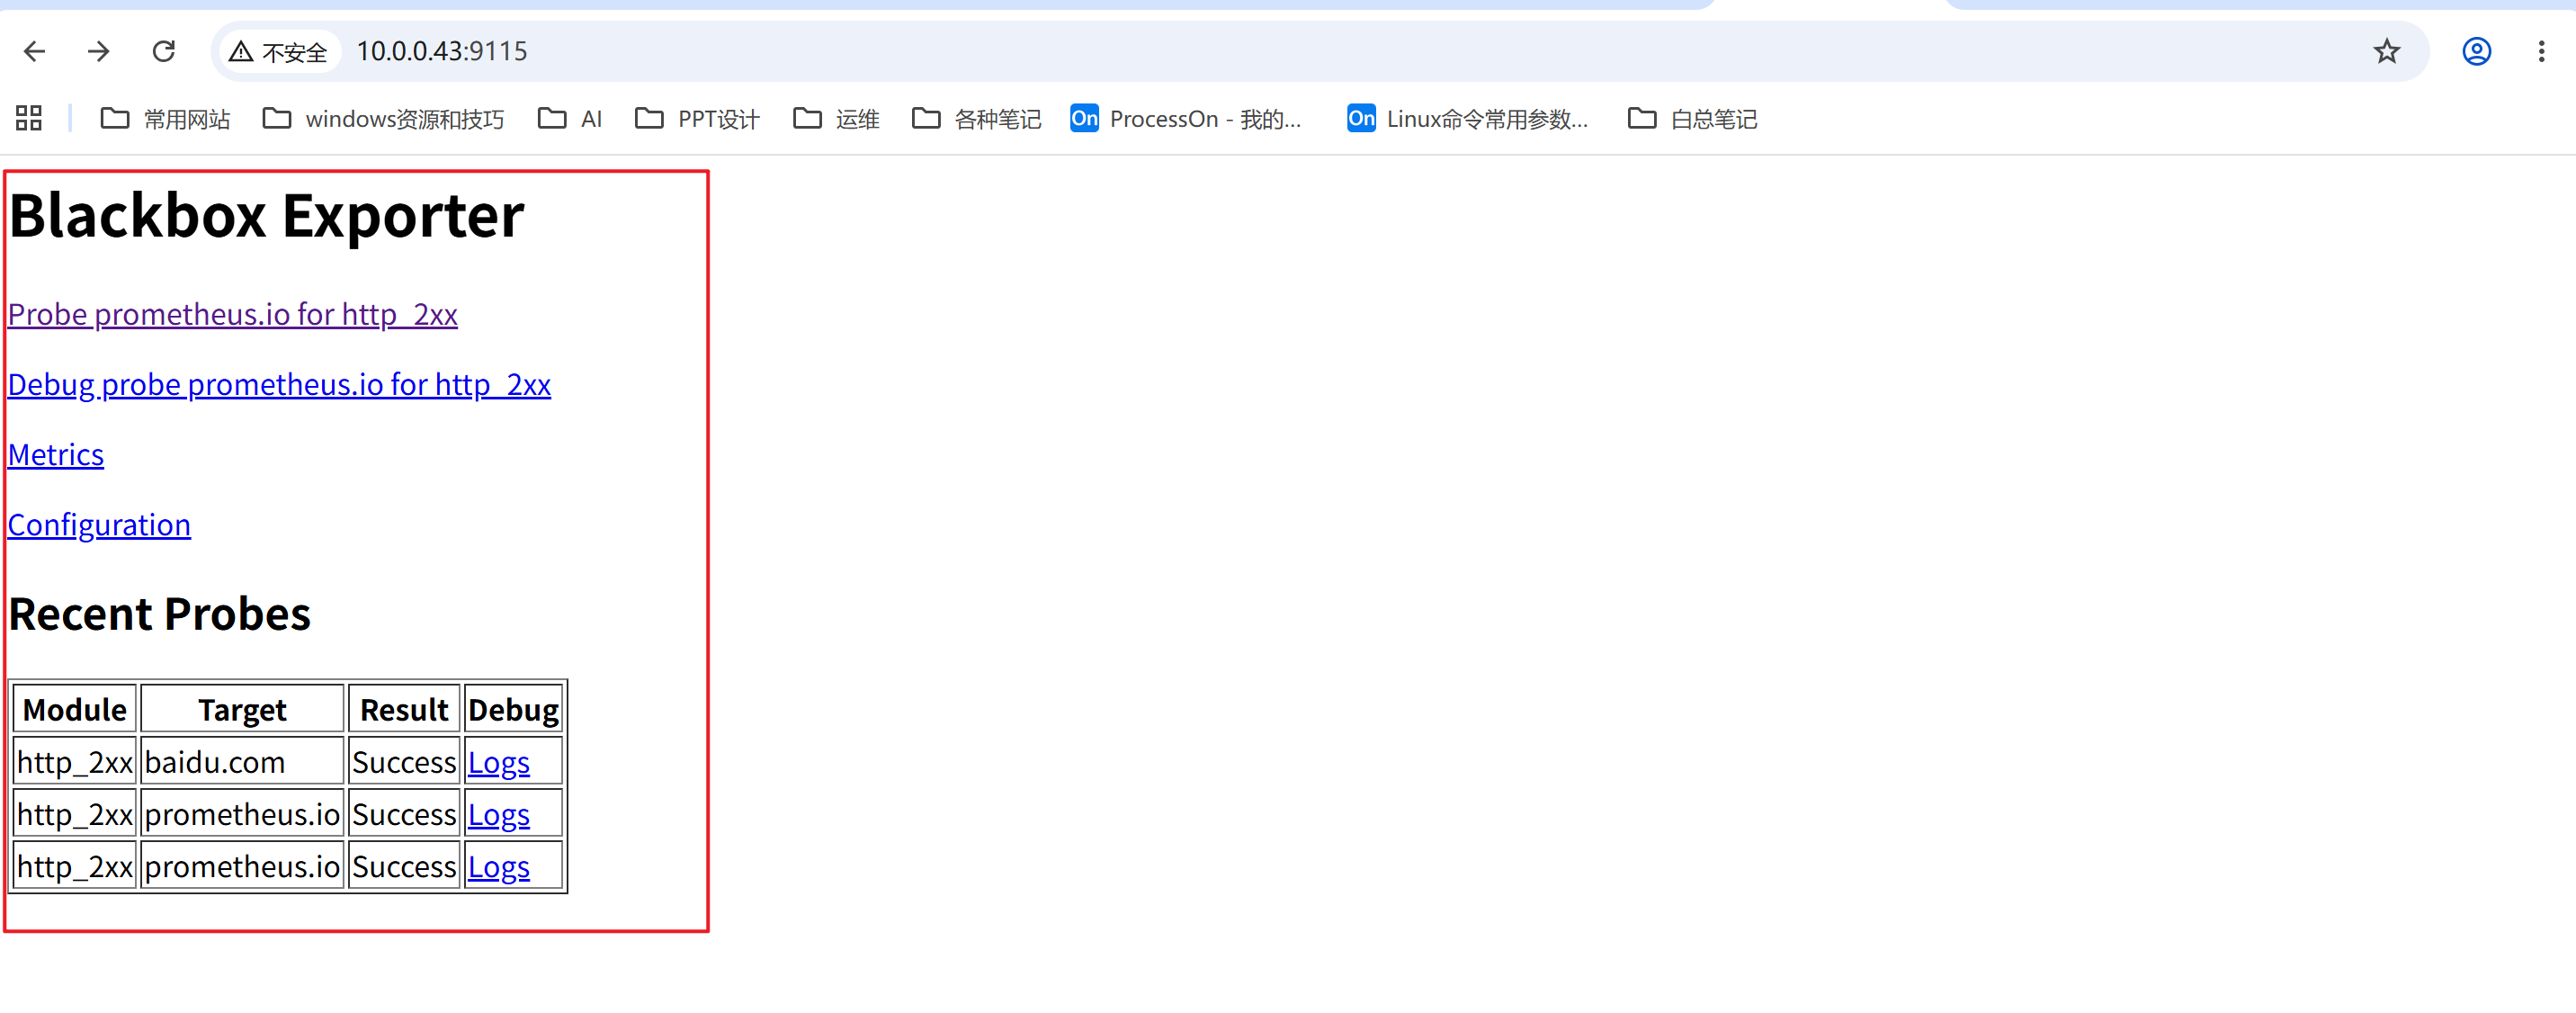
# 4. 访问blackbox的WebUI
http://10.0.0.43:9115/

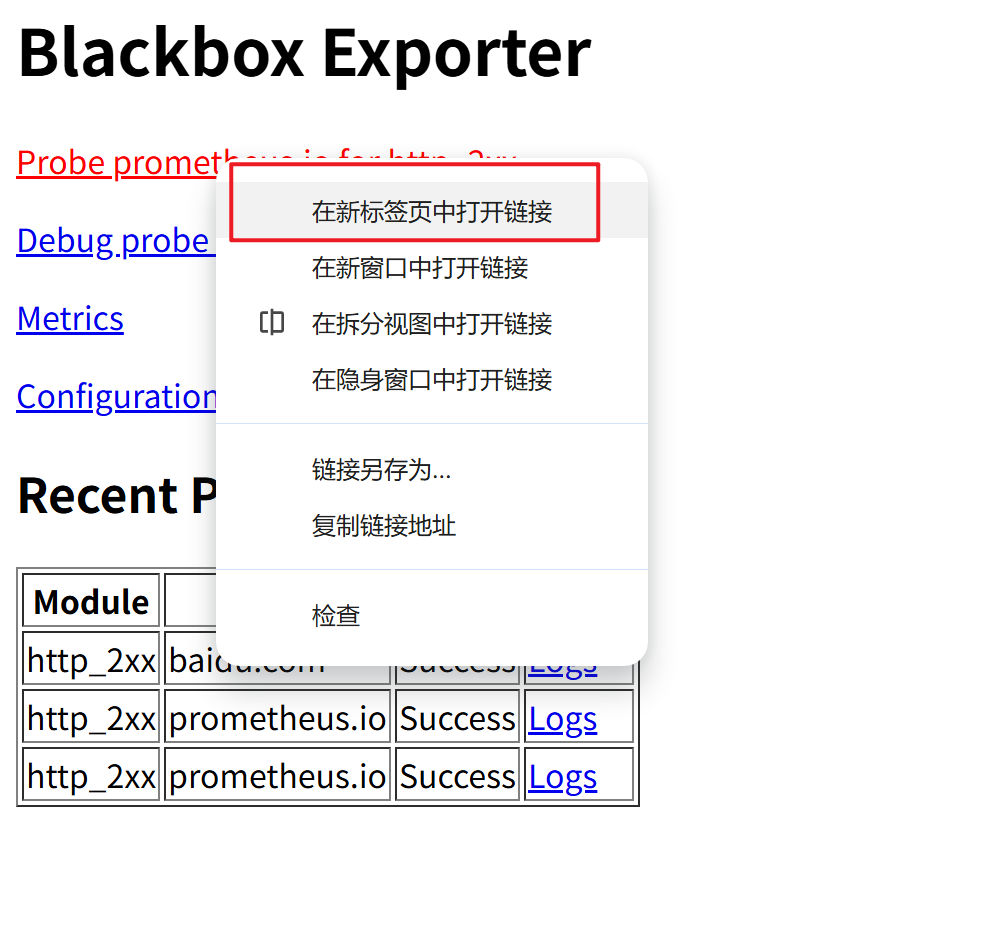
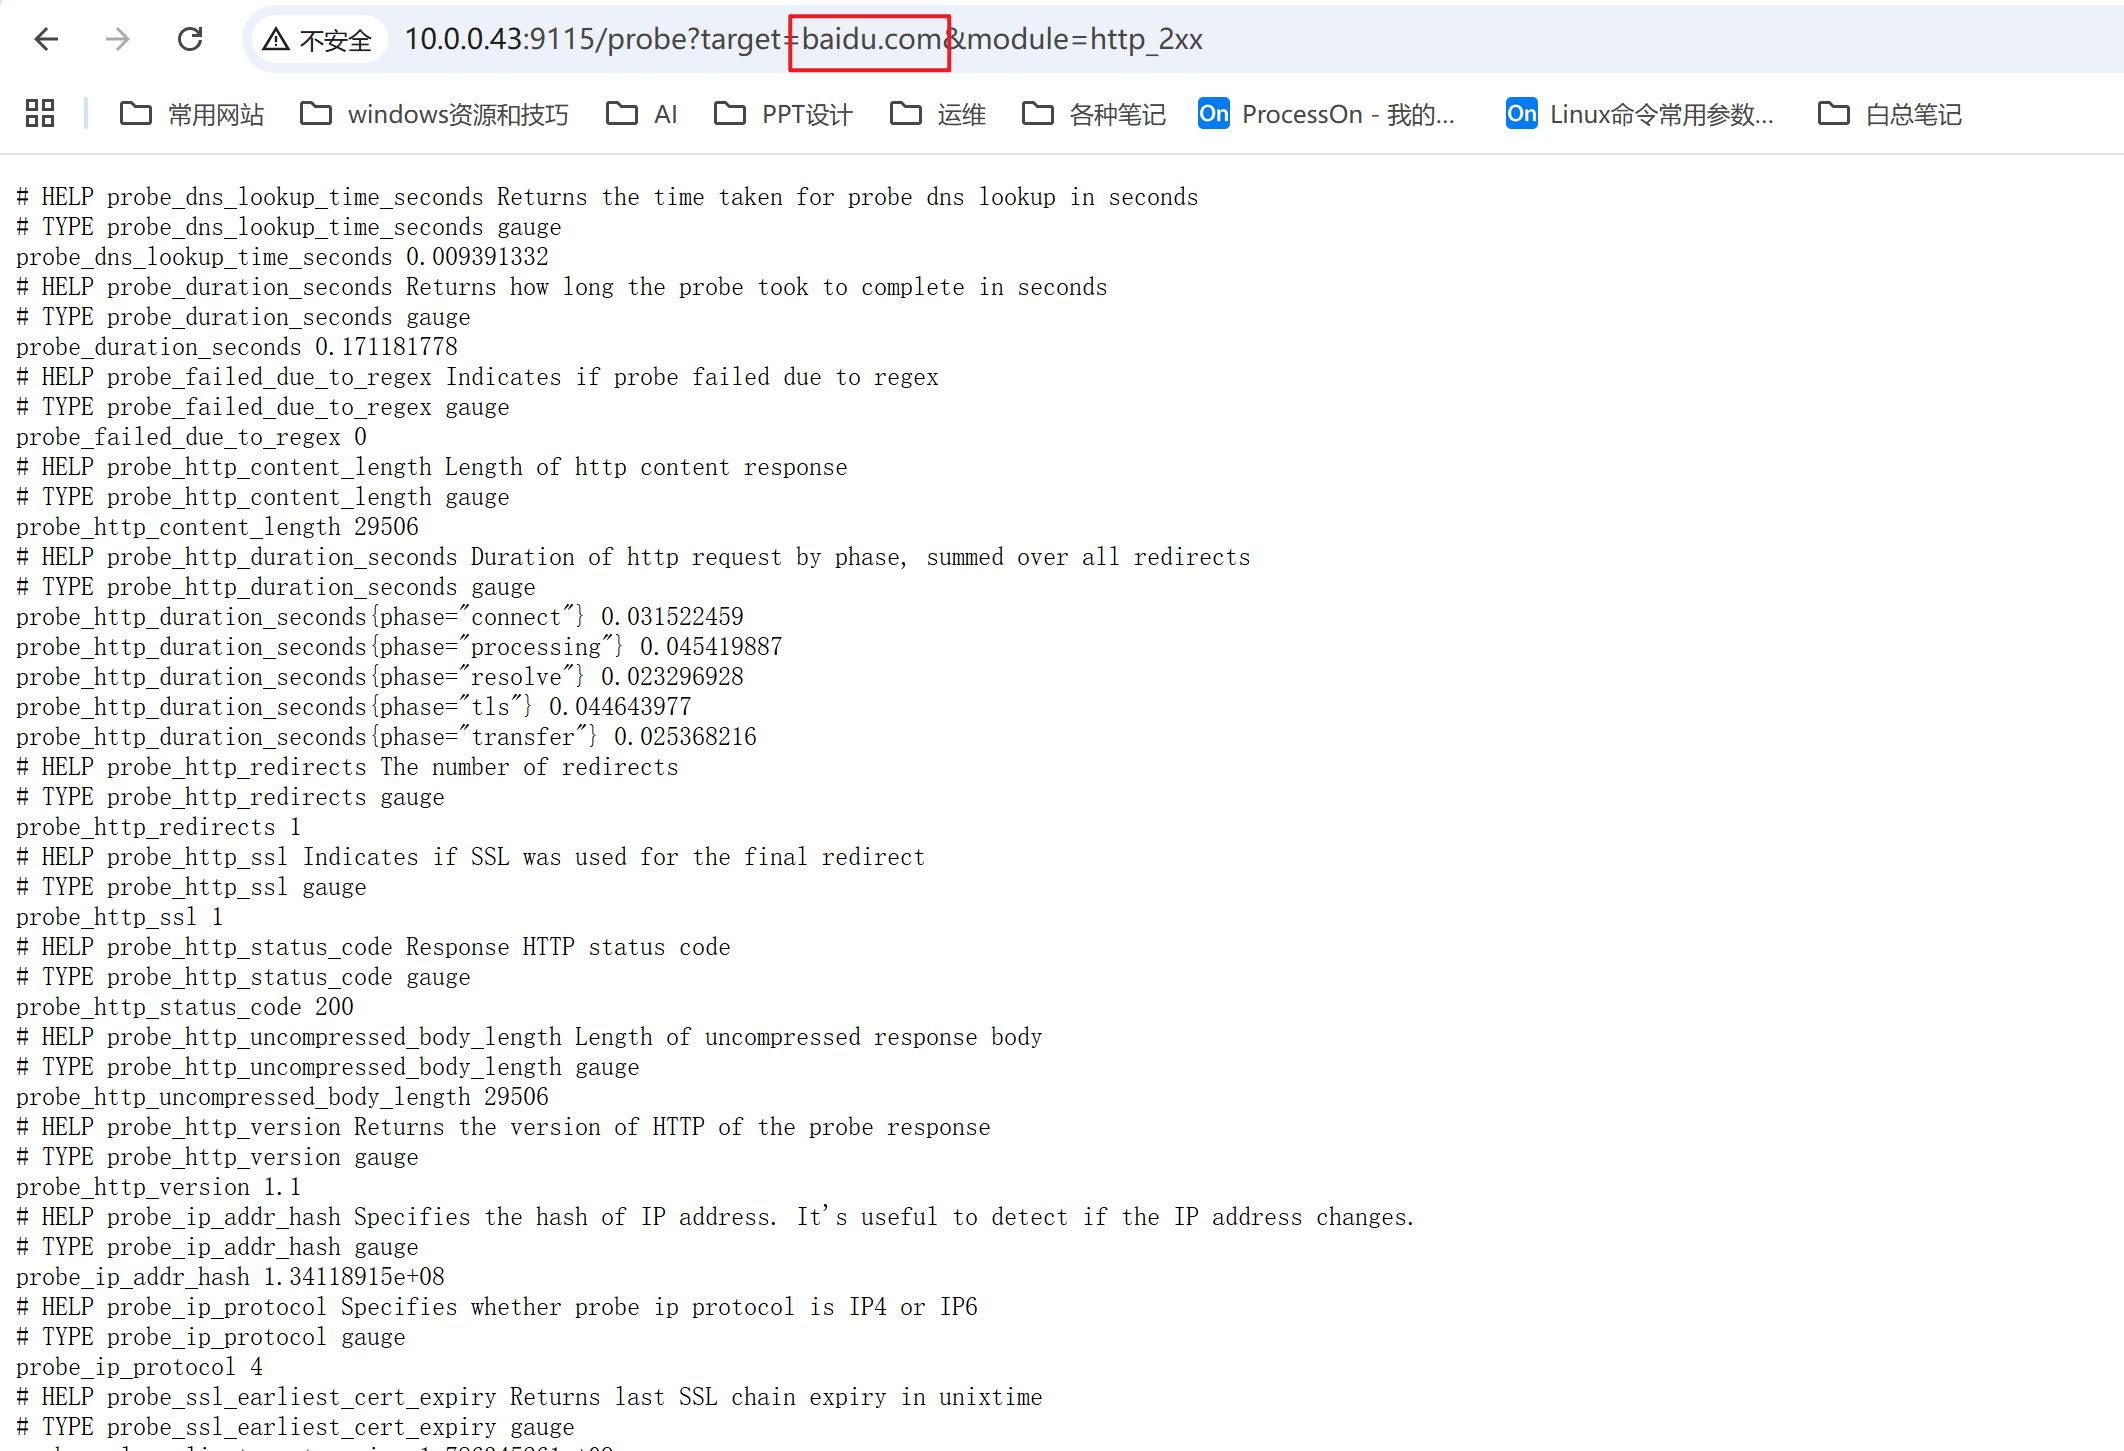
# 5. 访问测试
http://10.0.0.43:9115/probe?target=www.oldboyedu.com&module=http_2xx
http://10.0.0.43:9115/probe?target=prometheus.io&module=http_2xx
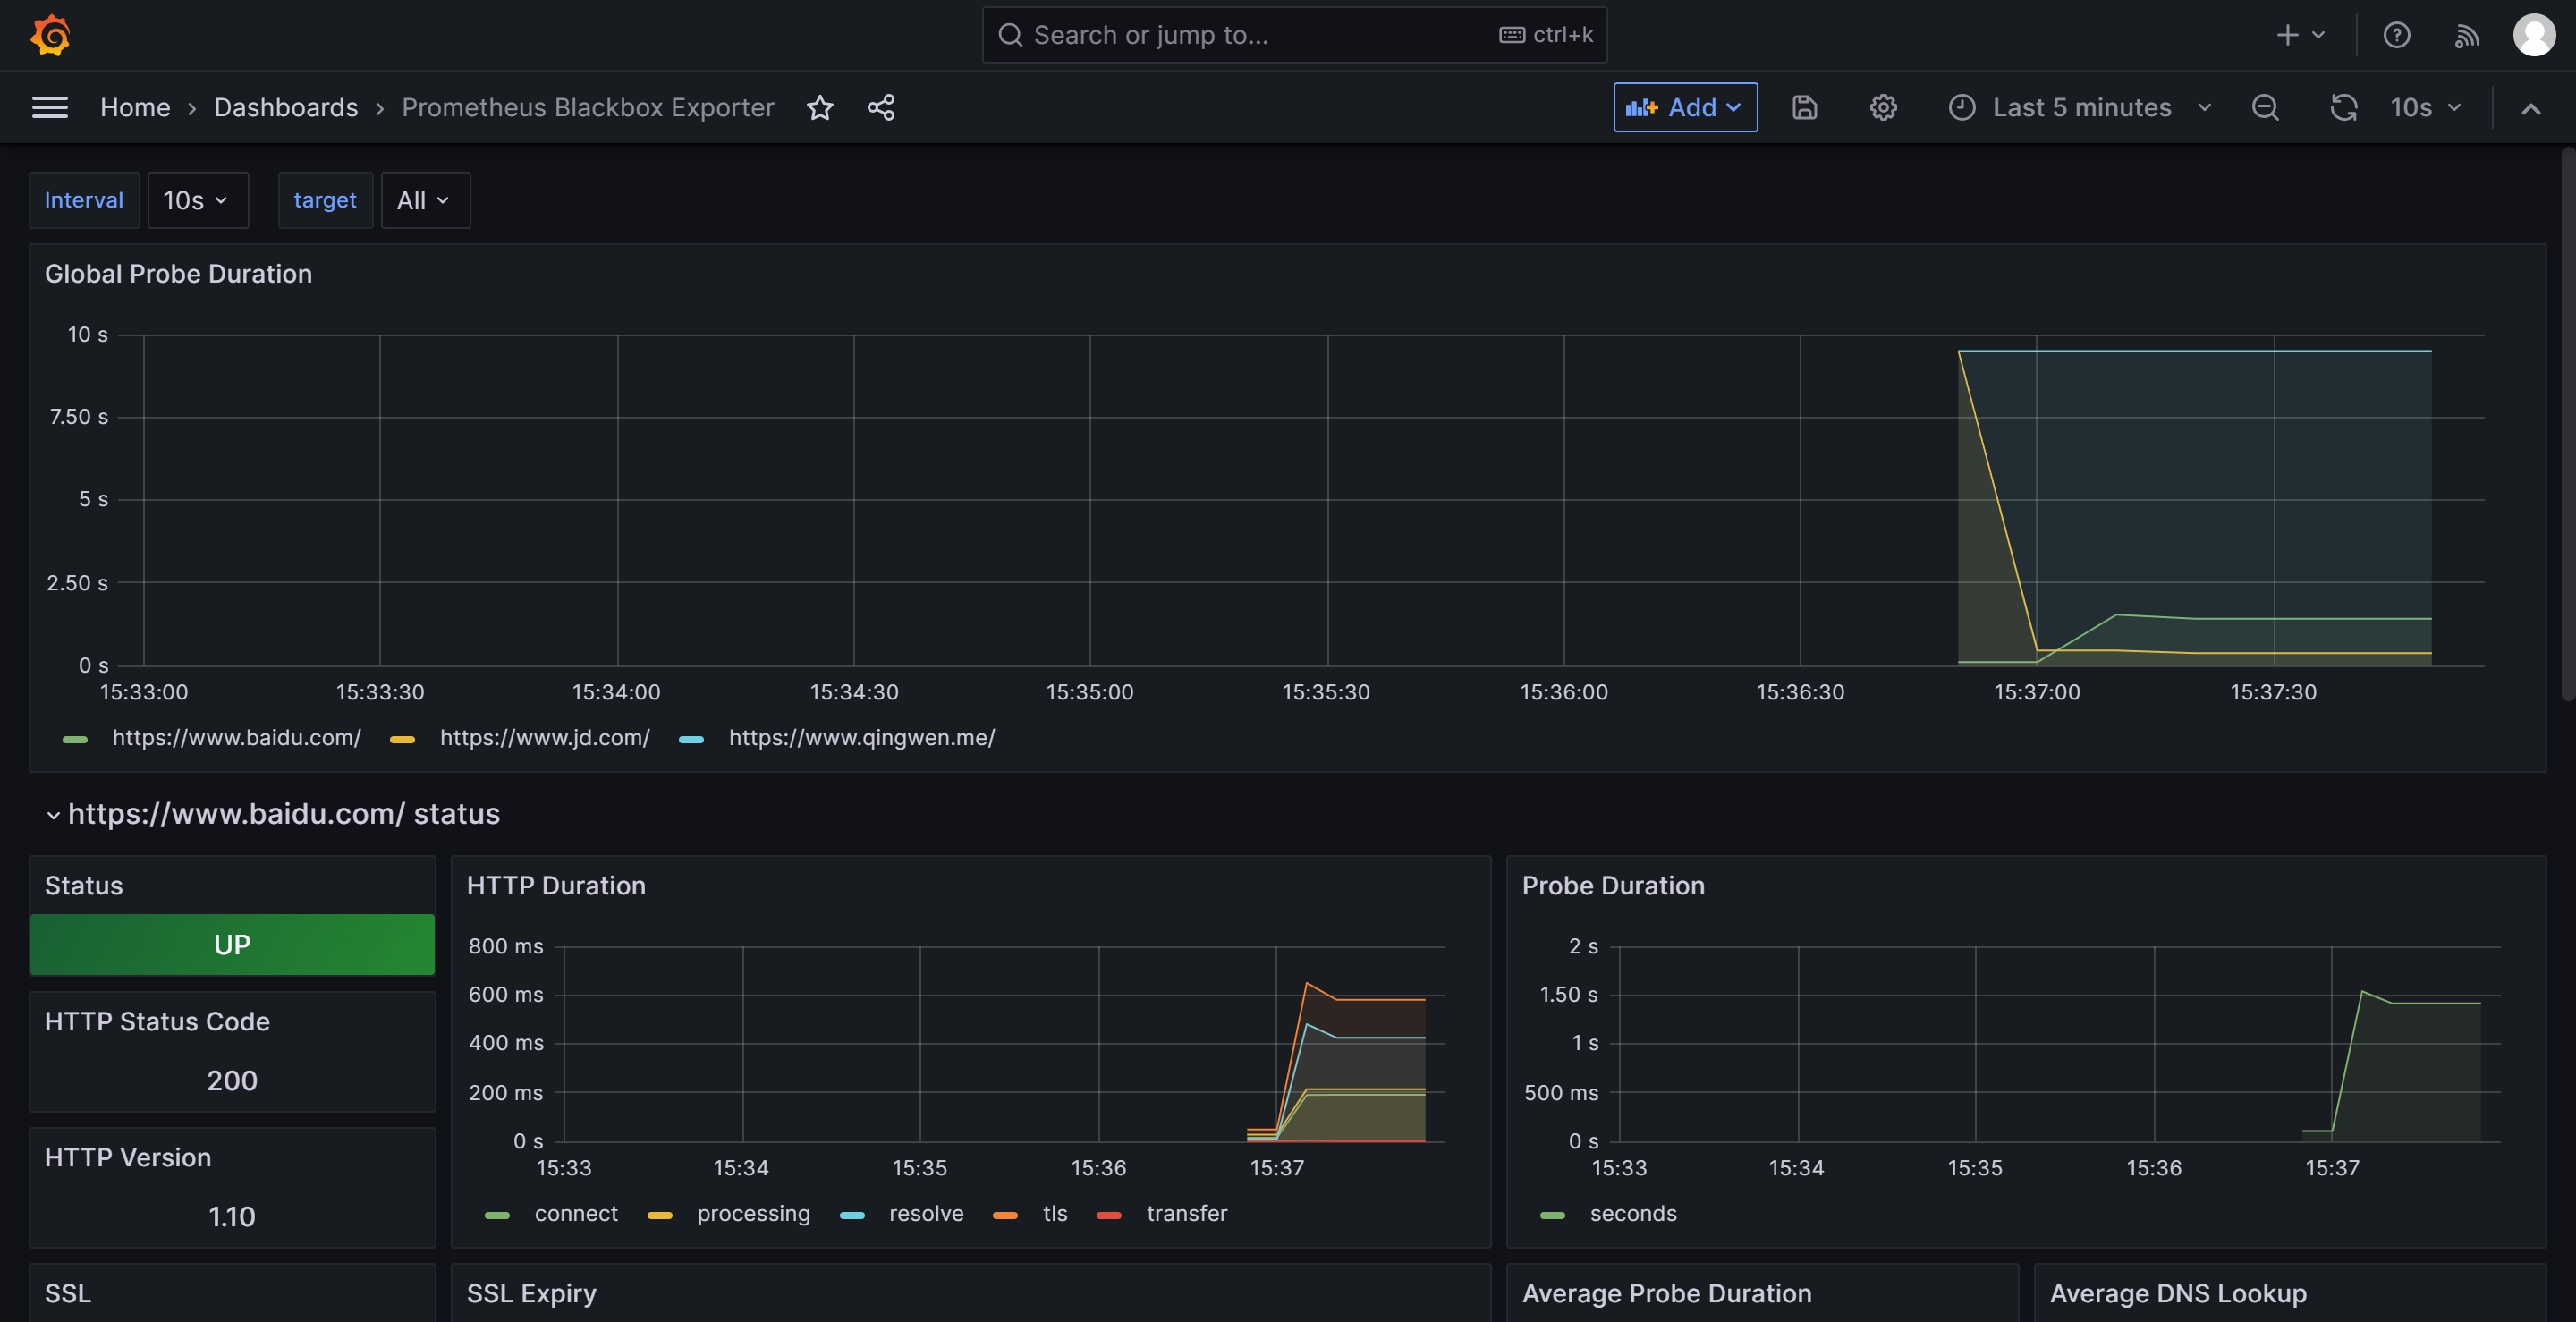
4.3 Prometheus Server整合Blackbox实现网站监控
# 1. 修改Prometheus的配置文件
[root@prometheus-server31 ~]# vim /oldboyedu/softwares/prometheus-2.53.4.linux-amd64/prometheus.yml
    # 指定作业的名称,生成环境中,通常是指一类业务的分组配置。
  - job_name: 'blackbox-exporter-http'
    # 修改访问路径,若不修改,默认值为"/metrics"
    metrics_path: /probe
    # 配置URL的相关参数
    params:
      # 此处表示使用的是blackbox的http模块,从而判断相应的返回状态码是否为200
      module: [http_2xx]
    # 静态配置,需要手动指定监控目标
    static_configs:
        # 需要监控的目标
      - targets:
          # 支持https协议
        - https://www.baidu.com/
          # 支持http协议
        - https://www.jd.com/
          # 支持http协议和自定义端口
        - https://www.qingwen.me/
    # 对目标节点进行重新打标签配置
    relabel_configs:
        # 指定源标签,此处的"__address__"表示内置的标签,存储的是被监控目标的IP地址
      - source_labels: [__address__]
        # 指定目标标签,其实就是在"Endpoint"中加了一个target字段(用于指定监控目标),
        target_label: __param_target
        # 指定需要执行的动作,默认值为"replace",常用的动作有: replace, keep, and drop。
        # 但官方支持十几种动作: https://prometheus.io/docs/prometheus/2.45/configuration/configuration/
        # 将"__address__"传递给target字段。
        action: replace
      - source_labels: [__param_target]
        target_label: instance
      - target_label: __address__
        # 指定要替换的值,此处我指定为blackbox exporter的主机地址
        replacement: 10.0.0.43:9115
# 2. 热加载配置
[root@prometheus-server31 ~]# curl -k -u k8s:yinzhengjie -X POST https://10.0.0.31:9090/-/reload

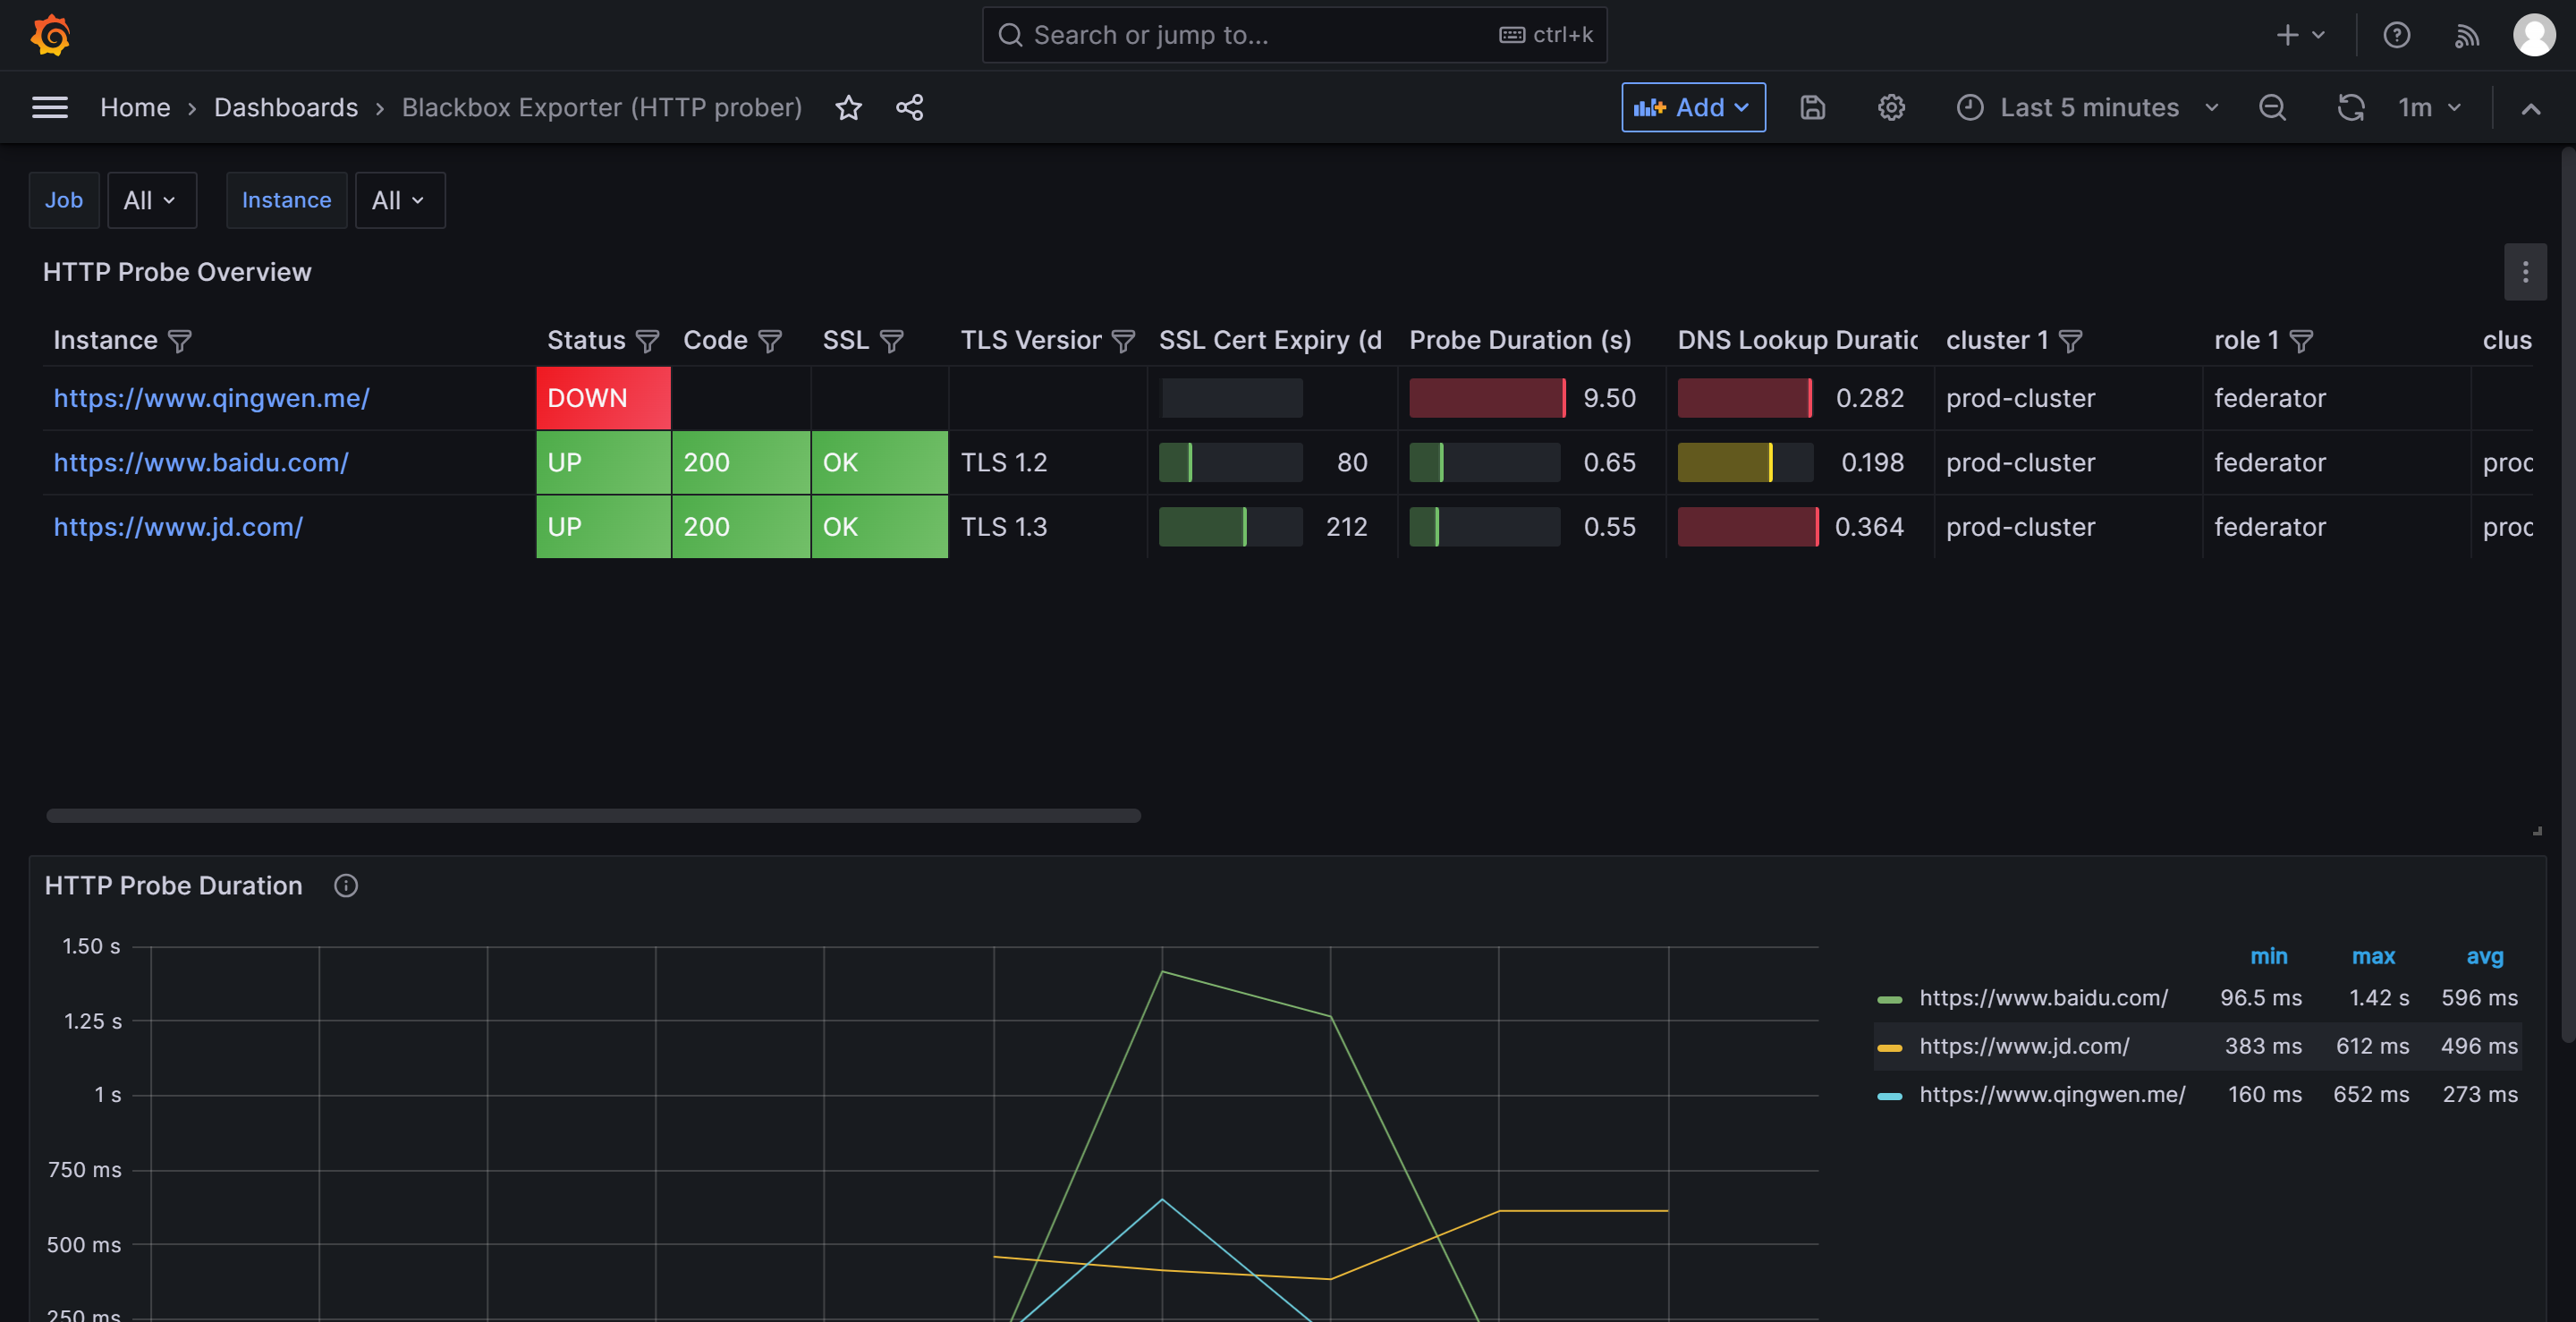
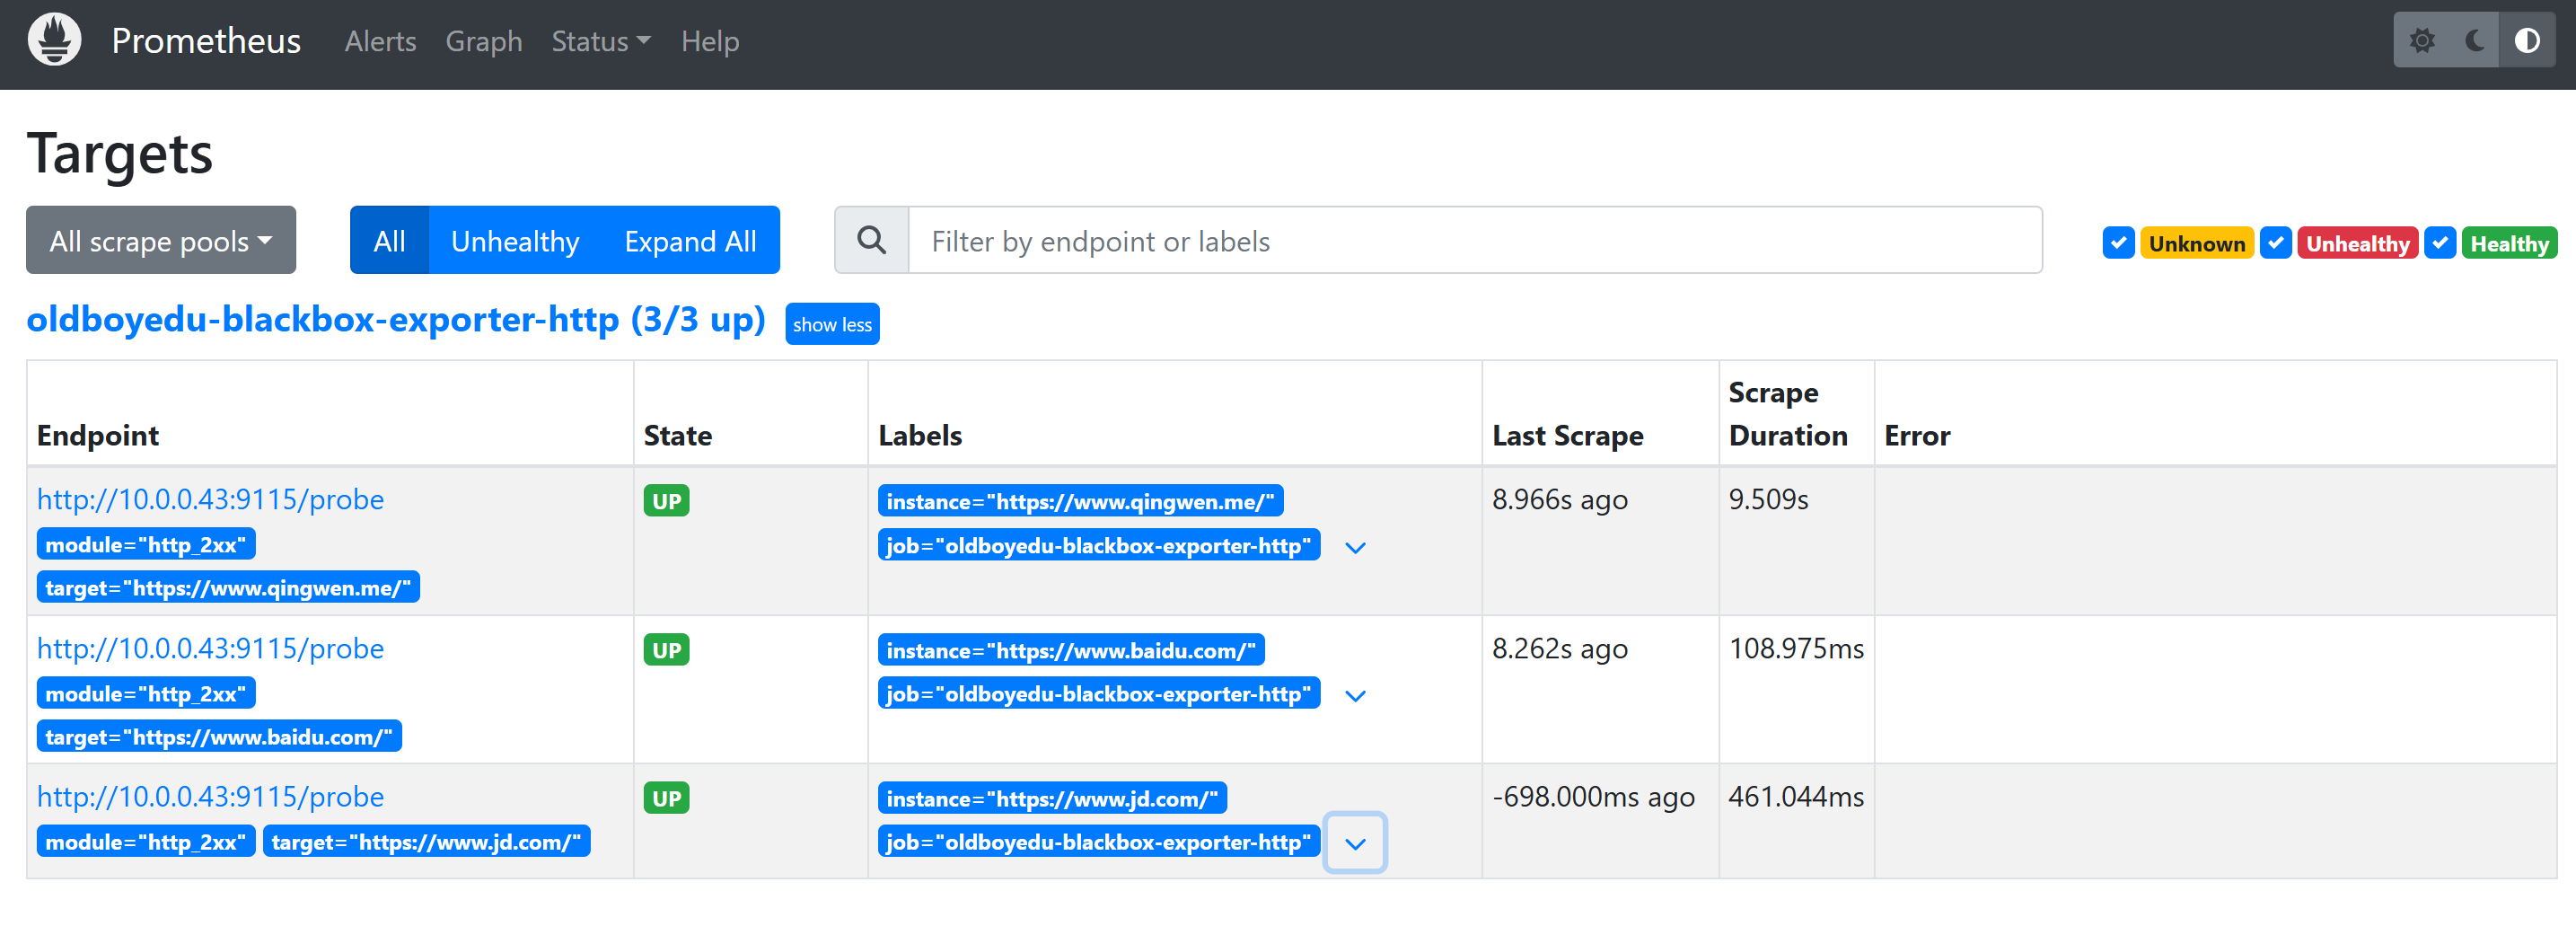
# 3. 验证WebUI
http://10.0.0.31:9090/targets?search=

# 4. 导入grafana的模板ID
# 模板ID:7587、13659
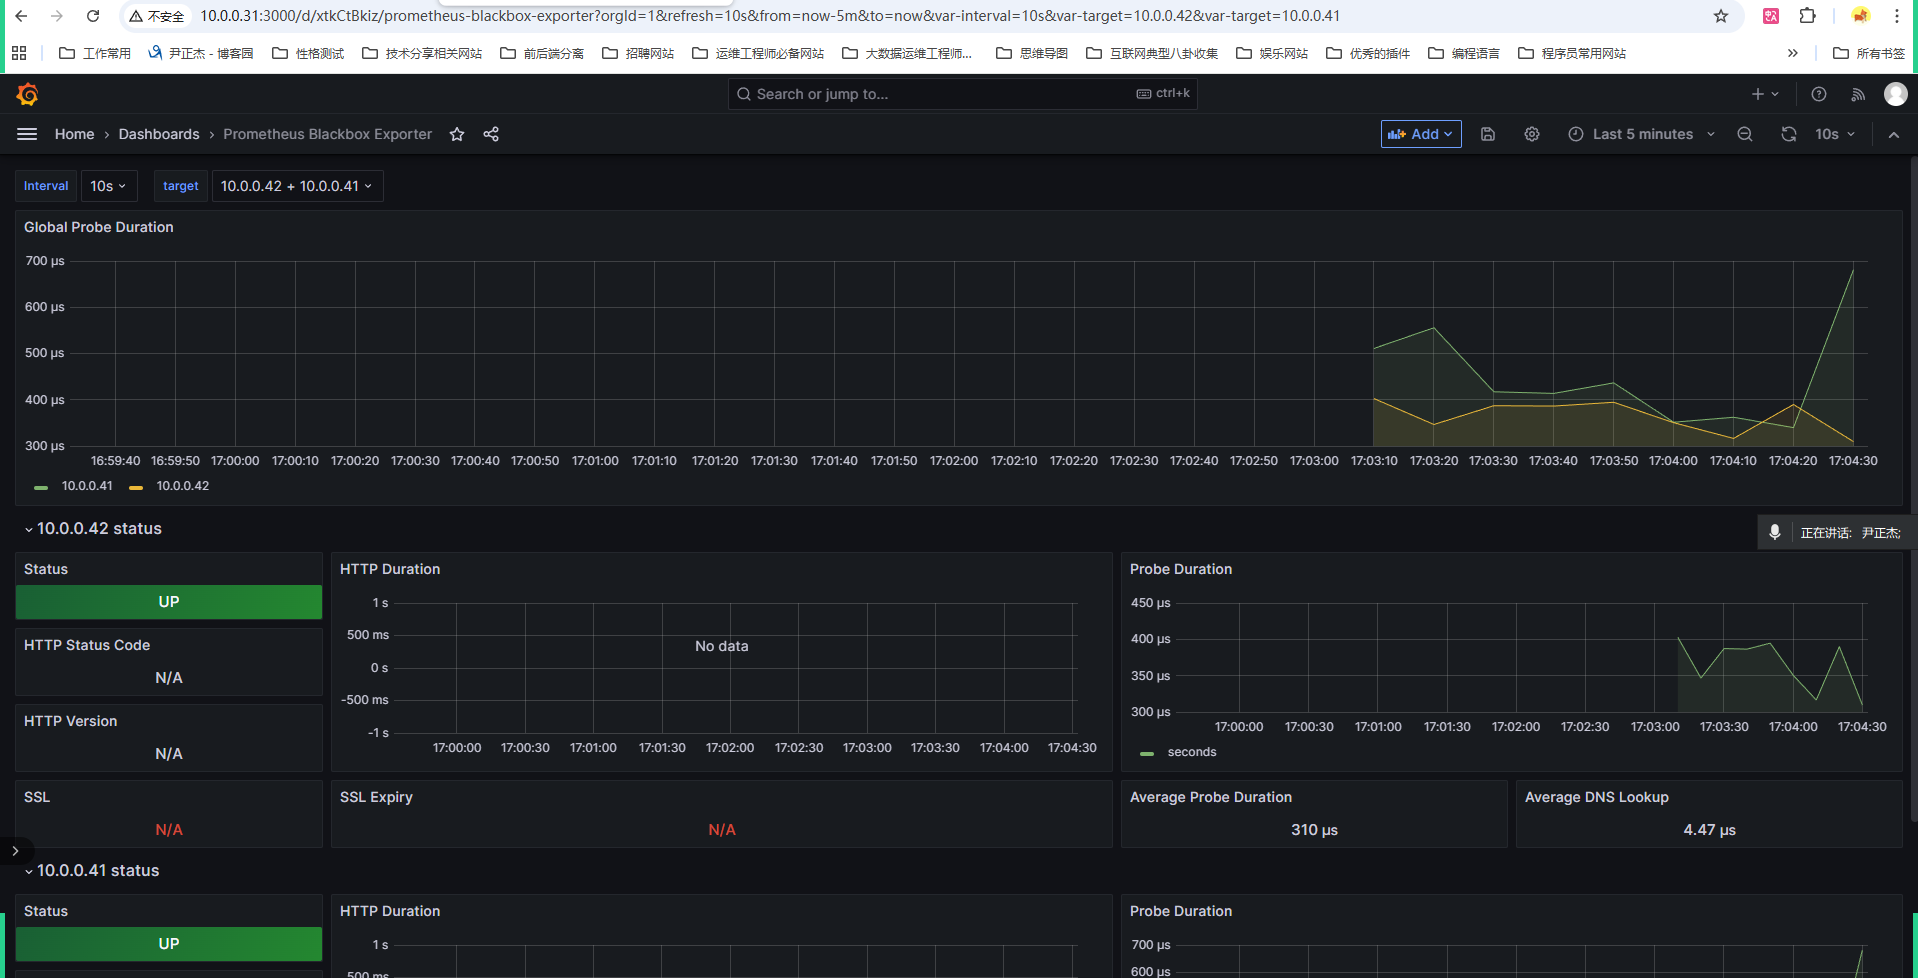
4.4 Prometheus基于Blackbox的ICMP监控目标主机是否存活
# 1. 修改Prometheus配置文件
[root@prometheus-server31 ~]# vim /oldboyedu/softwares/prometheus-2.53.4.linux-amd64/prometheus.yml
- job_name: 'oldboyedu-blackbox-exporter-icmp'
  metrics_path: /probe
  params:
    # 如果不指定模块,则默认类型为"http_2xx"
    module: [icmp]
  static_configs:
    - targets:
        - 10.0.0.41
        - 10.0.0.42
  relabel_configs:
    - source_labels: [__address__]
      target_label: __param_target
    - source_labels: [__param_target]
      target_label: instance
    - target_label: __address__
      replacement: 10.0.0.43:9115
# 2. 检查配置文件是否正确
[root@prometheus-server31 prometheus-2.53.4.linux-amd64]# ./promtool check config prometheus.yml
Checking prometheus.yml
 SUCCESS: prometheus.yml is valid prometheus config file syntax

# 3. 重新加载配置
[root@prometheus-server31 ~]# curl -k -u k8s:yinzhengjie -X POST https://10.0.0.31:9090/-/reload

# 4. 访问prometheus的WebUI
http://10.0.0.31:9090/targets

# 5. 访问blackbox的WebUI
http://10.0.0.41:9115/

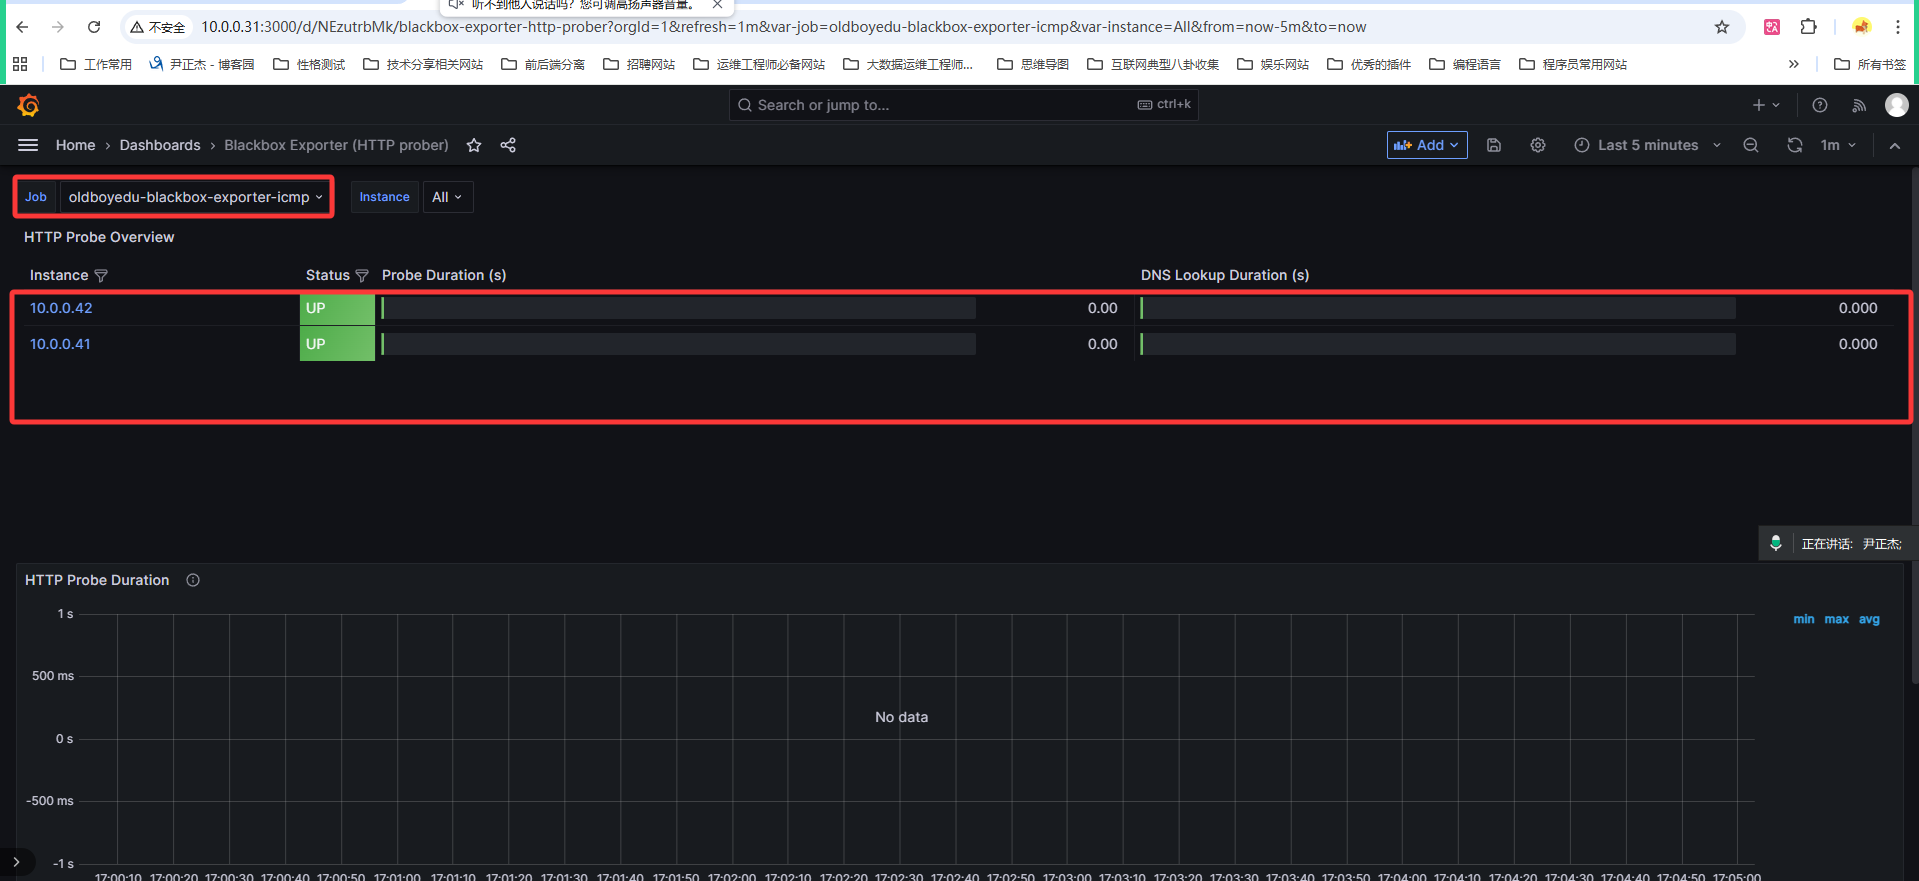
# 6. grafana过滤jobs数据
# 基于"oldboyedu-blackbox-exporter-icmp"标签进行过滤
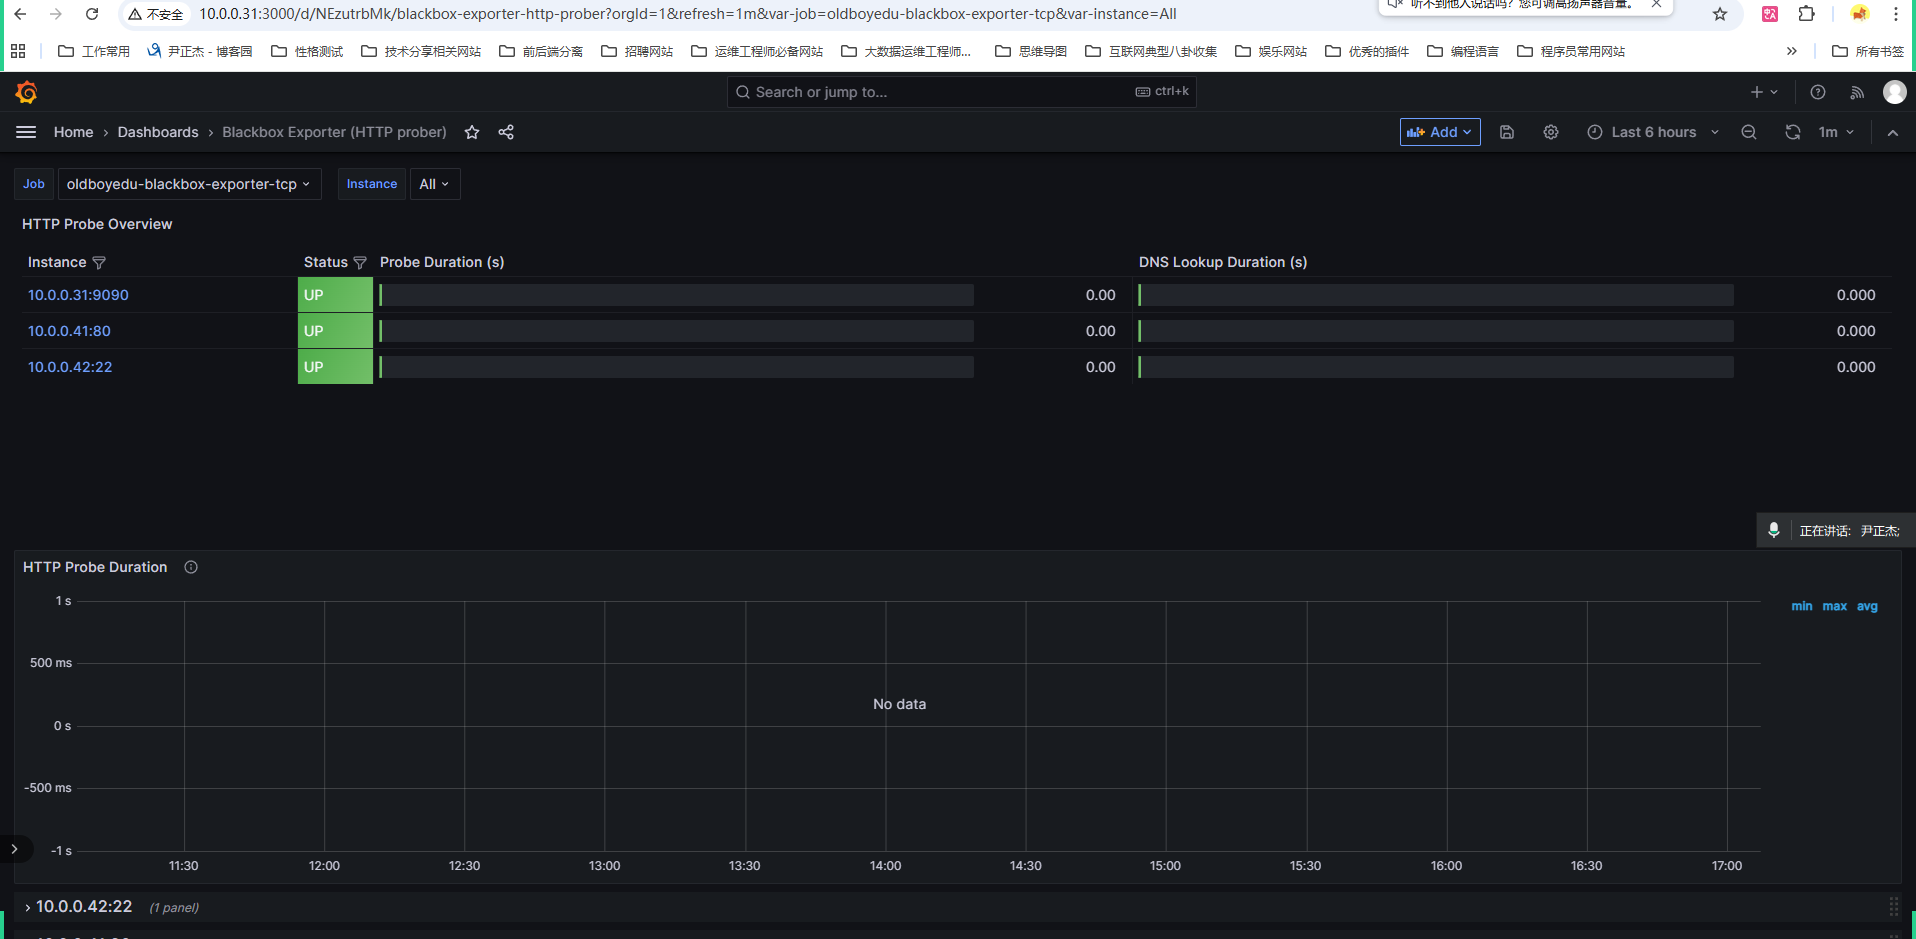
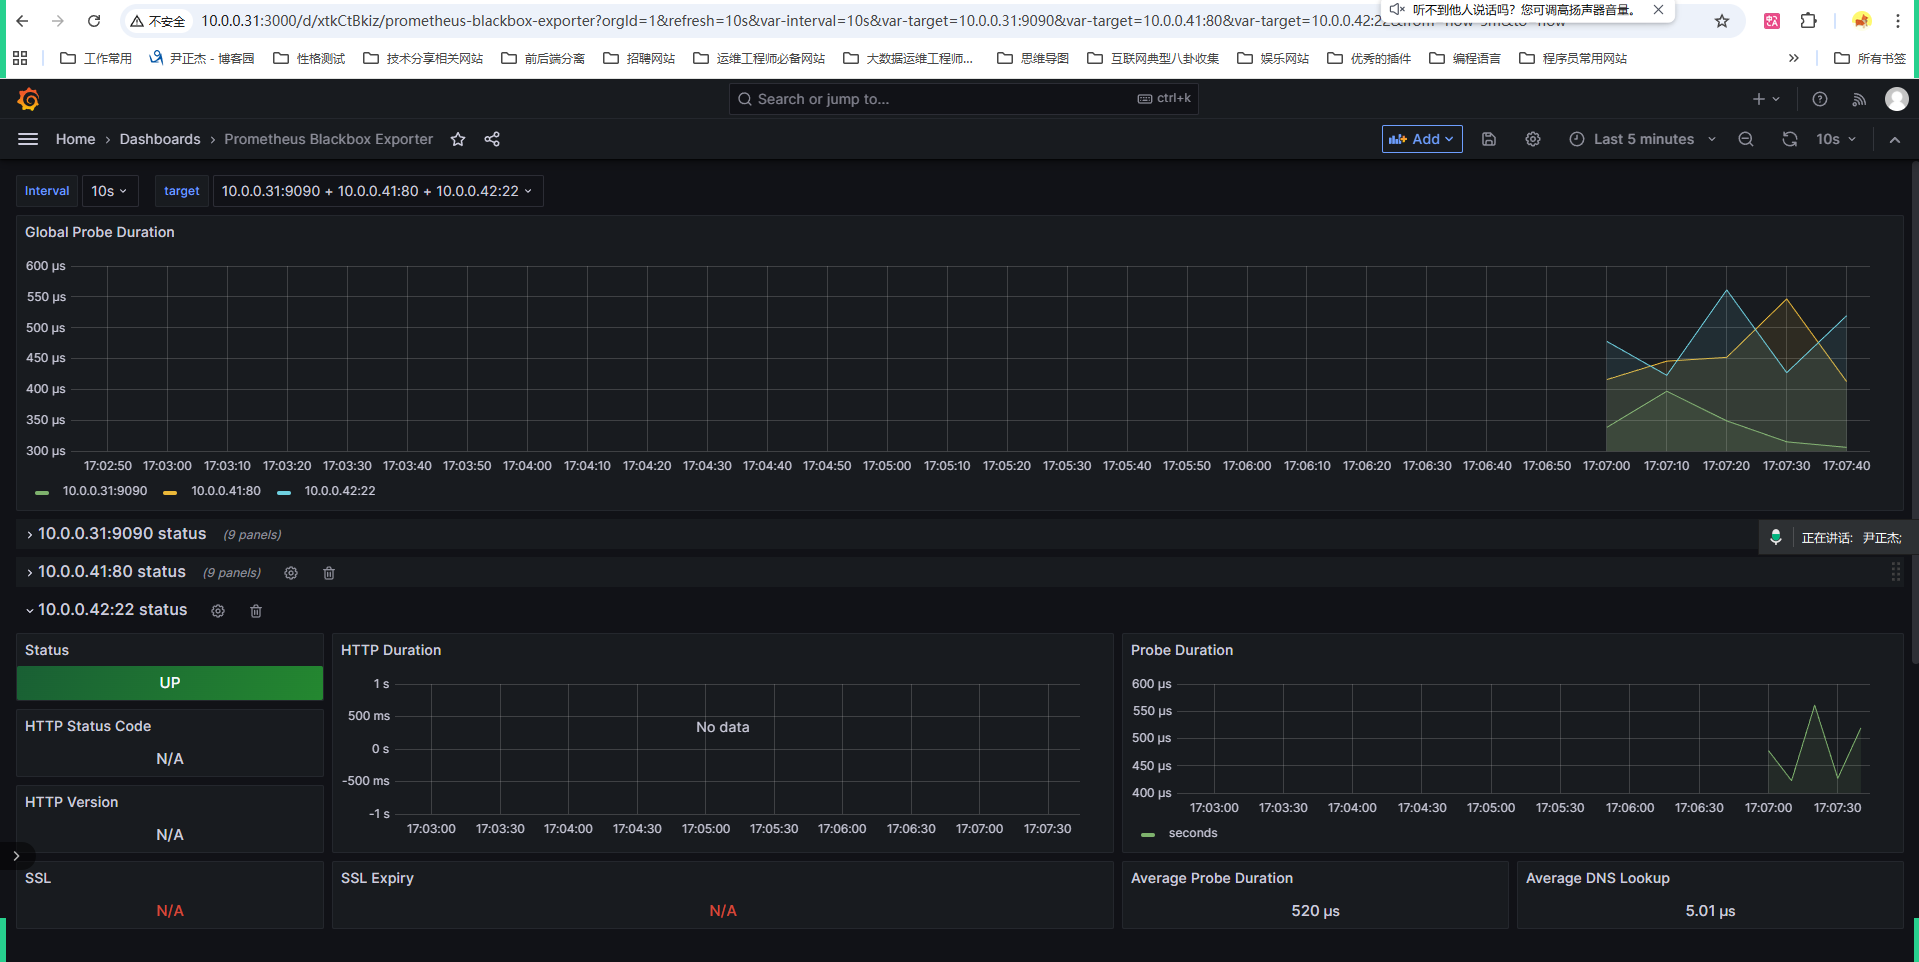
4.5 Prometheus基于Blackbox的TCP案例监控端口是否存活
# 1. 修改Prometheus配置文件
[root@prometheus-server31 prometheus-2.53.4.linux-amd64]# vim prometheus.yml
- job_name: 'oldboyedu-blackbox-exporter-tcp'
  metrics_path: /probe
  params:
    module: [tcp_connect]
  static_configs:
    - targets:
        - 10.0.0.41:80
        - 10.0.0.42:22
        - 10.0.0.31:9090
  relabel_configs:
    - source_labels: [__address__]
      target_label: __param_target
    - source_labels: [__param_target]
      target_label: instance
    - target_label: __address__
      replacement: 10.0.0.43:9115
# 2. 检查配置文件是否正确
[root@prometheus-server31 prometheus-2.53.4.linux-amd64]# ./promtool check config prometheus.yml
Checking prometheus.yml
 SUCCESS: prometheus.yml is valid prometheus config file syntax

# 3. 重新加载配置文件
[root@prometheus-server31 ~]# curl -k -u k8s:yinzhengjie -X POST https://10.0.0.31:9090/-/reload

# 4. 访问prometheus的WebUI
http://10.0.0.31:9090/targets

# 5. 访问blackbox exporter的WebUI
http://10.0.0.41:9115/

# 6. 使用grafana查看数据
# 基于"oldboyedu-blackbox-exporter-tcp"标签进行过滤
五、Grafana指定MySQL存储元数据信息
5.1 默认Grafana使用SQLite数据库
开发人员为了快速开发迭代,避免数据库的相关配置,节省资源,SQLite的确是一个不错的前期开发效率较高的数据库。
生产环境中,为了提升性能,建议Grafana数据库存储在MySQL或者PostgreSQL数据库中。
查看验证
# 1. 查看配置文件默认使用的数据库类型
[root@prometheus-server31 ~]# grep sqlite3 /etc/grafana/grafana.ini | grep -v ^#
;type = sqlite3

# 2. 本地校验的确使用的是SQLite数据库
[root@prometheus-server31 ~]# ll /var/lib/grafana/
total 3440
drwxr-xr-x  6 grafana grafana    4096 Nov 19 09:26 ./
drwxr-xr-x 61 root    root       4096 Nov 17 11:57 ../
drwxr-x---  3 grafana grafana    4096 Nov 17 11:57 alerting/
drwx------  2 grafana grafana    4096 Nov 17 11:57 csv/
-rw-r-----  1 grafana grafana 3493888 Nov 19 09:26 grafana.db
drwxr-xr-x  3 root    root       4096 Nov 18 10:35 plugins/
drwx------  2 grafana grafana    4096 Nov 17 11:57 png/

[root@prometheus-server31 ~]# file /var/lib/grafana/grafana.db
/var/lib/grafana/grafana.db: SQLite 3.x database, last written using SQLite version 3044000, file counter 1290, database pages 853, 1st free page 849, free pages 21, cookie 0x1d0, schema 4, UTF-8, version-valid-for 1290
5.2 修改Grafana数据源
# 1. 部署MySQL环境
docker run -d \
	--network host \
	--name mysql-server \
	--restart always \
	-e MYSQL_DATABASE=prometheus \
	-e MYSQL_USER=prometheus \
	-e MYSQL_PASSWORD=qingwen666 \
	-e MYSQL_ALLOW_EMPTY_PASSWORD=yes \
	mysql:8.0.36-oracle \
	--character-set-server=utf8 \
	--collation-server=utf8_bin \
	--default-authentication-plugin=mysql_native_password

# 2. 查看MySQL数据库
[root@node-exporter41 ~]# docker ps -l
CONTAINER ID   IMAGE                 COMMAND                  CREATED         STATUS         PORTS     NAMES
7ad05a0cb6be   mysql:8.0.36-oracle   "docker-entrypoint.s…"   4 seconds ago   Up 4 seconds             mysql-server

[root@node-exporter41 ~]# ss -ntl | grep 3306
LISTEN 0      70                 *:33060            *:*
LISTEN 0      151                *:3306             *:*

# 3. 修改Grafana的配置文件
[root@prometheus-server31 ~]# vim /etc/grafana/grafana.ini
[database]
...
type = mysql
host = 10.0.0.42:3306
name = prometheus
user = prometheus
password = qingwen666

[security]
# 在首次启动Grafana时禁用管理员用户创建
;disable_initial_admin_creation = false
# 默认管理员用户,启动时创建,若不指定则默认为admin
;admin_user = admin
# 指定默认的密码
;admin_password = admin
# 默认的邮箱地址
;admin_email = admin@localhost
# 4. 重启Grafana使得配置生效
[root@prometheus-server31 ~]# systemctl restart grafana-server.service
[root@prometheus-server31 ~]# ss -ntl | grep 3000
LISTEN 0      4096               *:3000            *:*

# 5. 验证MySQL
[root@node-exporter43 ~]# docker exec -it mysql-server mysql prometheus
mysql> SELECT DATABASE();
+------------+
| DATABASE() |
+------------+
| prometheus |
+------------+
1 row in set (0.00 sec)

mysql> SHOW TABLES;
+-------------------------------+
| Tables_in_prometheus          |
+-------------------------------+
| alert                         |
| alert_configuration           |
| alert_configuration_history   |
| dashboard                     |
| dashboard_acl                 |
| data_source                   |
| org                           |
| org_user                      |
| user                          |
...(共82行)
+-------------------------------+
82 rows in set (0.00 sec)

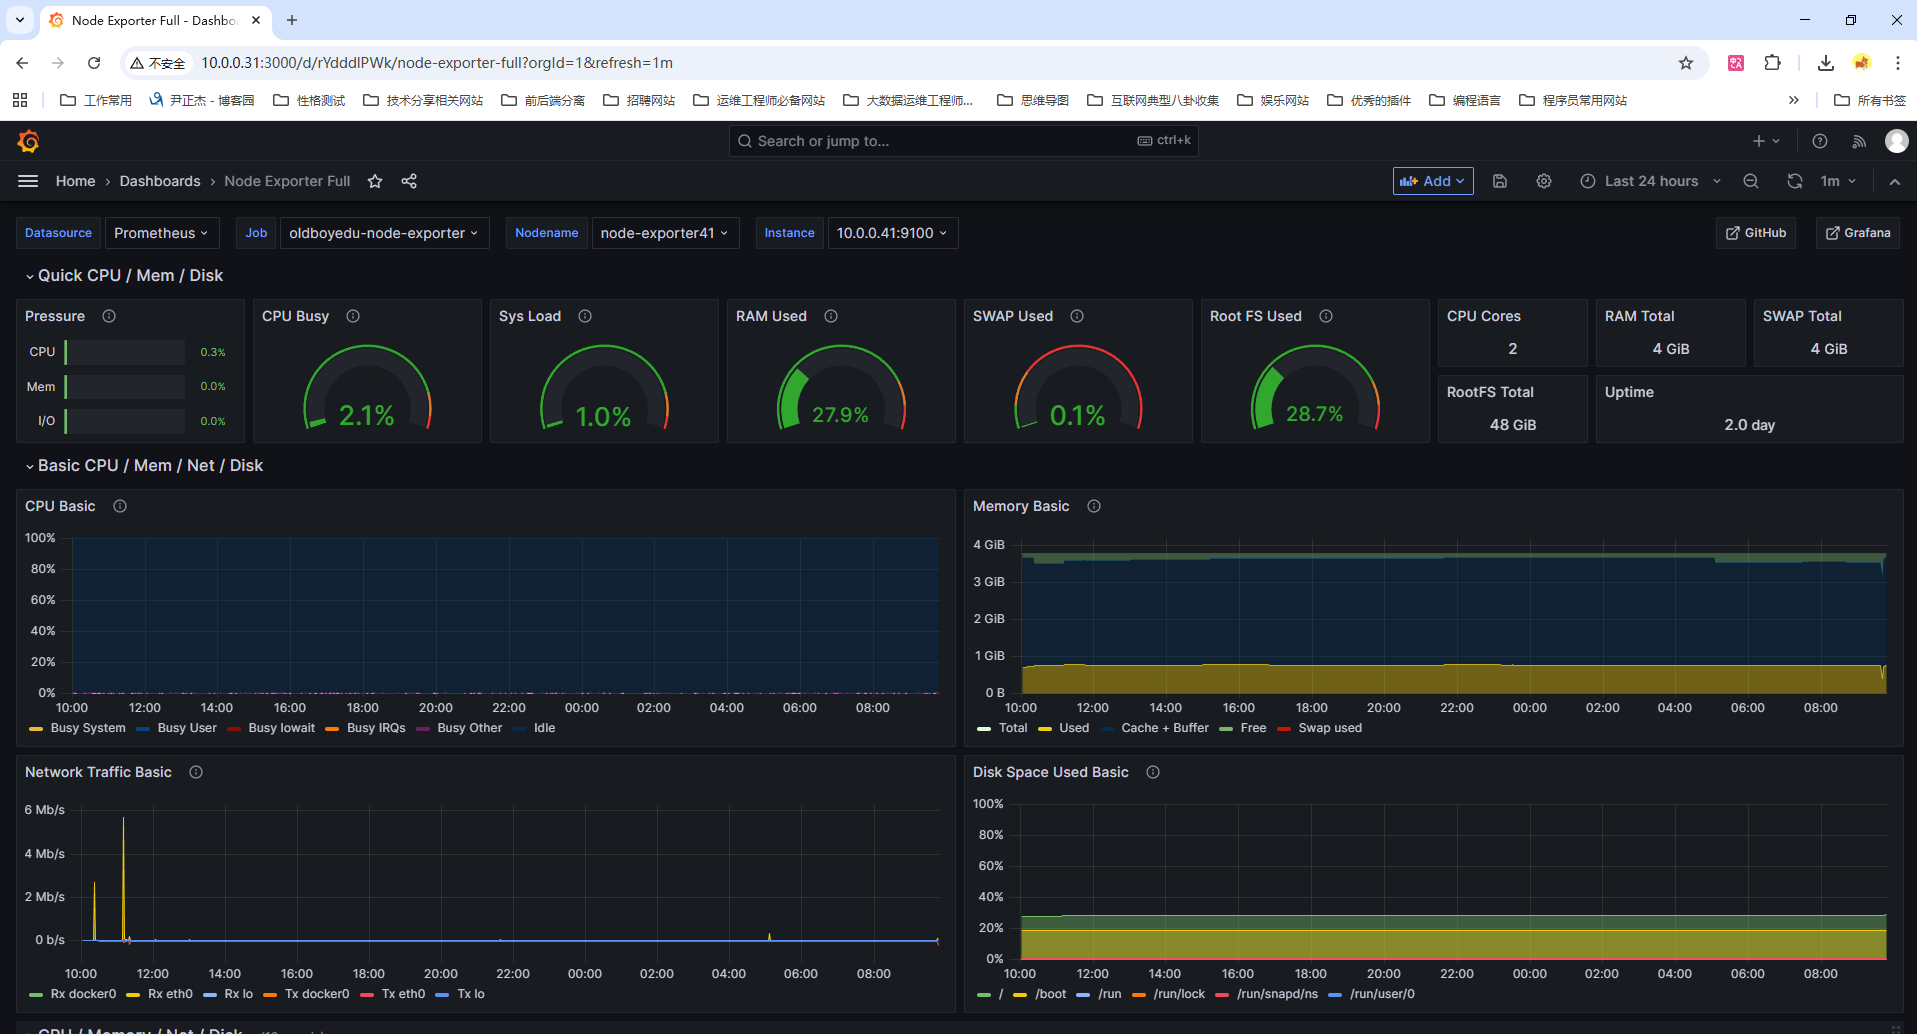
# 6. 导入模板测试能够正常工作
# 模板ID:1860
注意:修改数据库配置会把原来配置好的dashboard清空,甚至数据源也会清空。

汇聚全球AI编程工具,助力开发者即刻编程。
更多推荐



 12
12 0
0- 0


 已为社区贡献11条内容

所有评论(0)