
Prometheus 全方位监控实战(一):Prometheus、Grafana 安装
内容概览
|
模块 |
核心内容 |
|
01 Prometheus架构 |
核心组件、架构图解、与Zabbix对比 |
|
02 环境部署 |
二进制部署、WebUI访问 |
|
03 监控Linux主机 |
node-exporter部署、Prometheus配置、热加载 |
|
04 PromQL语句 |
数据类型、操作符、常用函数 |
|
05 Grafana展示 |
安装配置、数据源添加、Dashboard导入 |
|
06 监控中间件 |
Windows、Docker(cAdvisor)、MySQL |
|
07 监控流程 |
标准化监控步骤 |
一、Prometheus概述
1.1 什么是Prometheus?
Prometheus是一款开源的监控系统,可以监控主流的中间件、操作系统、硬件设备、网络设备等。
|
对比项 |
Zabbix |
Prometheus |
|
强项 |
传统基础设施监控 |
容器、微服务监控 |
|
数据模型 |
关系型数据库 |
时序数据库 |
|
发现机制 |
手动配置/自动注册 |
服务发现(K8s/Consul) |
|
查询语言 |
较简单 |
PromQL(功能强大) |
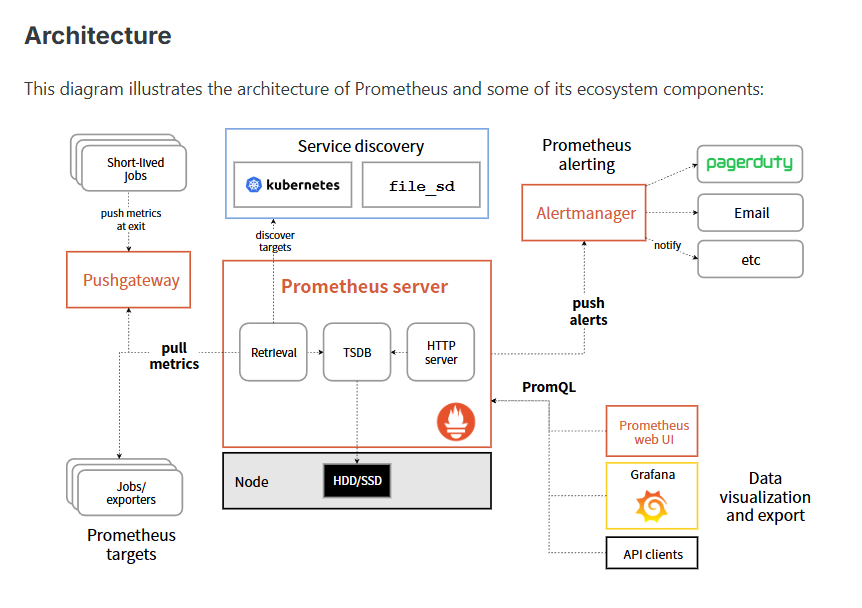
1.2 Prometheus架构图
┌─────────────────────────────────────────────────────────────────┐
│                         Prometheus 架构                          │
├─────────────────────────────────────────────────────────────────┤
│                                                                  │
│  ┌─────────────┐      ┌─────────────┐      ┌─────────────┐      │
│  │   Grafana   │◄────►│  Prometheus │◄────►│ Alertmanager│      │
│  │  (可视化)   │      │   Server    │      │   (告警)    │      │
│  └─────────────┘      └──────┬──────┘      └─────────────┘      │
│                              │                                   │
│              ┌───────────────┼───────────────┐                   │
│              │ pull          │ pull          │ push              │
│              ▼               ▼               ▼                   │
│        ┌──────────┐    ┌──────────┐    ┌─────────────┐          │
│        │exporter  │    │exporter  │    │Pushgateway  │          │
│        │(Linux)   │    │(MySQL)   │    │(自定义监控) │          │
│        └──────────┘    └──────────┘    └─────────────┘          │
│                                                                  │
└─────────────────────────────────────────────────────────────────┘
1.3 核心组件作用
|
组件 |
作用 |
|
Prometheus Server |
采集目标数据、存储时序数据、提供WebUI查询接口 |
|
Exporters |
被监控端,暴露metrics指标 |
|
Grafana |
将Prometheus作为数据源,提供Dashboard可视化展示 |
|
Pushgateway |
支持短期临时任务推送监控数据 |
|
Alertmanager |
告警功能,支持钉钉、企业微信、邮箱等 |
GitHub:https://github.com/prometheus/prometheus
二、Prometheus环境部署
2.1 环境准备
|
主机 |
IP |
配置 |
操作系统 |
角色 |
|
prometheus-server31 |
10.0.0.31 |
1C2G+ |
Ubuntu 22.04 |
Prometheus Server + Grafana |
|
node-exporter41 |
10.0.0.41 |
1C1G |
Ubuntu 22.04 |
被监控端(Linux) |
|
node-exporter42 |
10.0.0.42 |
1C1G |
Ubuntu 22.04 |
被监控端(Linux) |
|
node-exporter43 |
10.0.0.43 |
1C1G |
Ubuntu 22.04 |
被监控端(Linux) |
2.2 二进制部署Prometheus
# 1. 下载软件包
wget https://github.com/prometheus/prometheus/releases/download/v3.5.3/prometheus-3.5.3.linux-amd64.tar.gz

# 2. 解压到指定目录
tar xf prometheus-3.5.3.linux-amd64.tar.gz -C /usr/local/

# 3. 运行Prometheus
cd /usr/local/prometheus-3.5.3.linux-amd64/
./prometheus

# 4. 访问WebUI
http://10.0.0.31:9090/

# 5. 卸载(直接删除目录)
rm -rf /usr/local/prometheus-3.5.3.linux-amd64/
三、Prometheus监控Linux主机
3.1 node-exporter部署
什么是node-exporter?
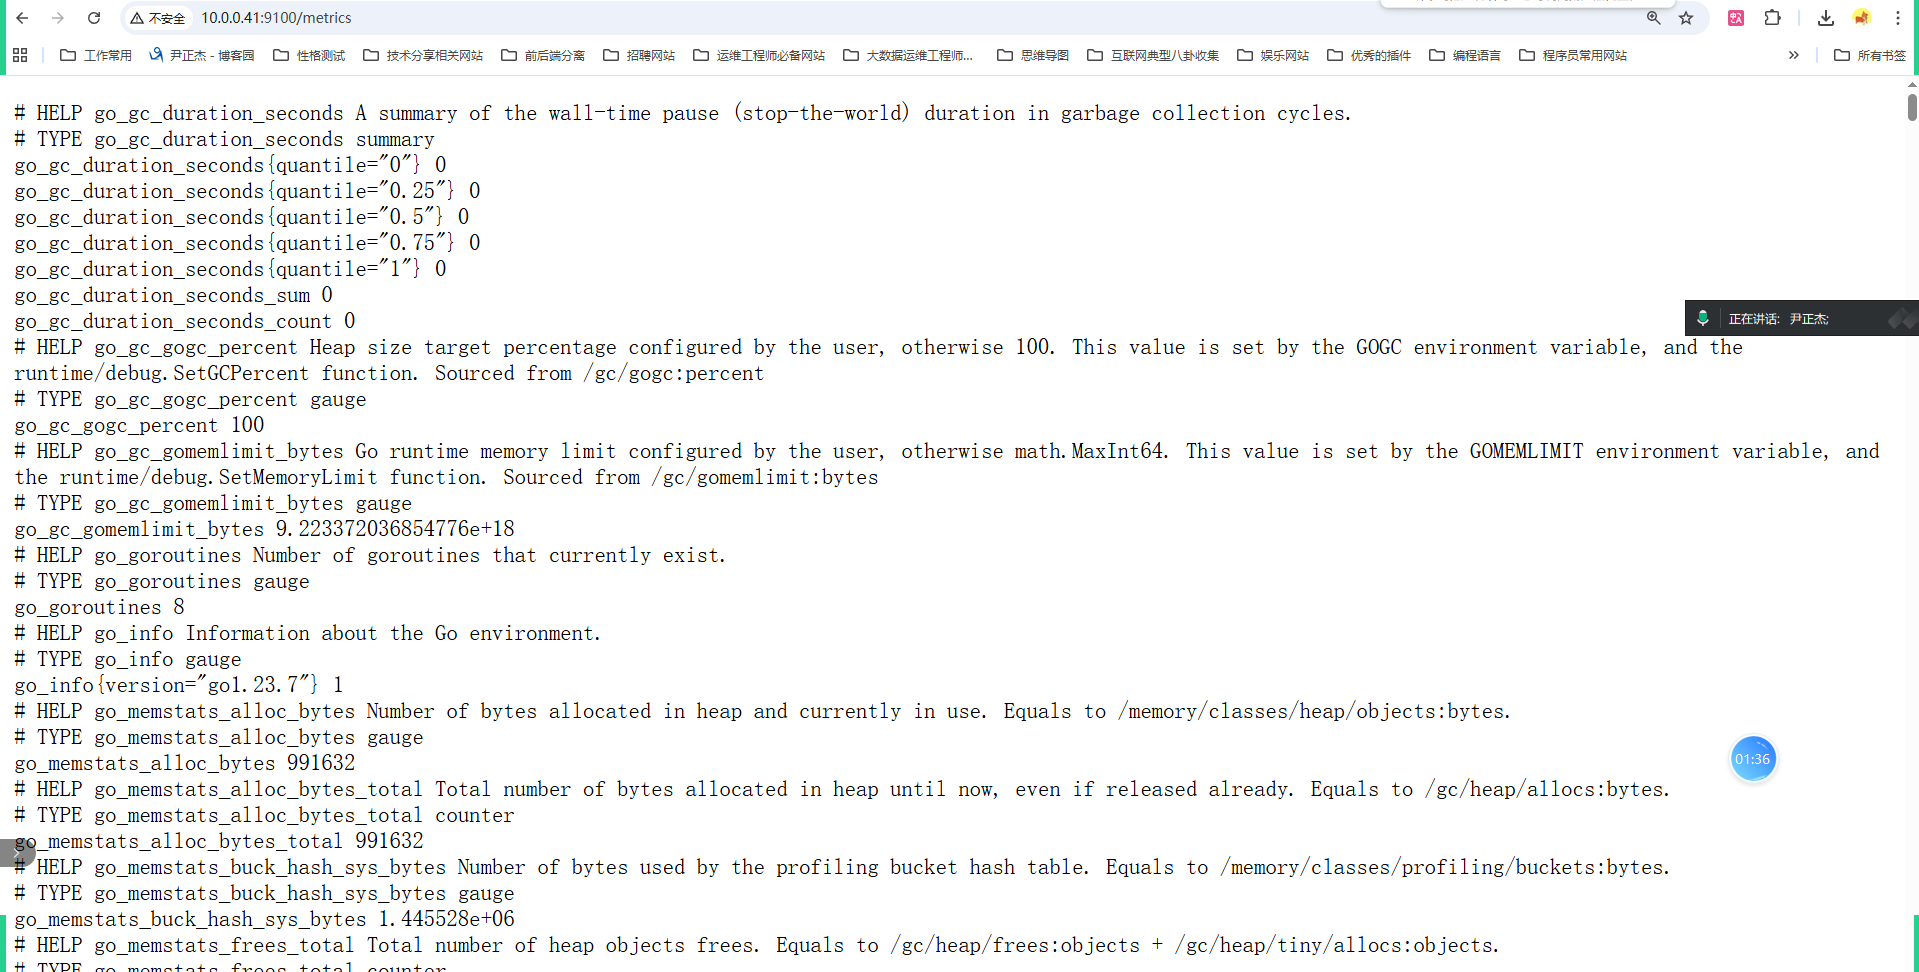
node-exporter是Prometheus官方开源的一款用来暴露Linux系统指标的组件,包括CPU、内存、磁盘、网络、文件系统、负载等。
# 1. 下载软件包
wget https://github.com/prometheus/node_exporter/releases/download/v1.11.1/node_exporter-1.11.1.linux-amd64.tar.gz

# 2. 解压
tar xf node_exporter-1.10.2.linux-amd64.tar.gz -C /usr/local/

# 3. 运行node-exporter
cd /usr/local/node_exporter-1.10.2.linux-amd64/
./node_exporter

# 4. 验证metrics接口
curl -s http://10.0.0.41:9100/metrics | wc -l
# 输出:1116(表示有1116个监控指标)

# 5. 卸载
rm -rf /usr/local/node_exporter-1.10.2.linux-amd64/
3.2 node-exporter
3.3 Prometheus配置监控
# 1. 在被监控端安装node-exporter(42、43同理)
# 2. 修改Prometheus配置文件
vim /oldboyedu/softwares/prometheus-2.53.4.linux-amd64/prometheus.yml
global:
# 每间隔3秒进行数据采集,若不指定则默认为1分钟
scrape_interval: 3s
scrape_configs:
# 指定job任务的名称,可以自定义
- job_name: "oldboyedu-node-exporter"
# 访问被监控的路径
metrics_path: "/metrics"
# 访问被监控的协议
scheme: "http"
# 指定被监控端的后端地址
static_configs:
- targets: ["10.0.0.41:9100", "10.0.0.42:9100", "10.0.0.43:9100"]# 3. 热加载配置文件(无需重启服务)
curl -X POST 10.0.0.31:9090/-/reload
# 4. 验证配置生效
http://10.0.0.31:9090/targets?search=
# 5. 测试查询指标
# 在Prometheus WebUI的Graph页面执行
node_cpu_seconds_total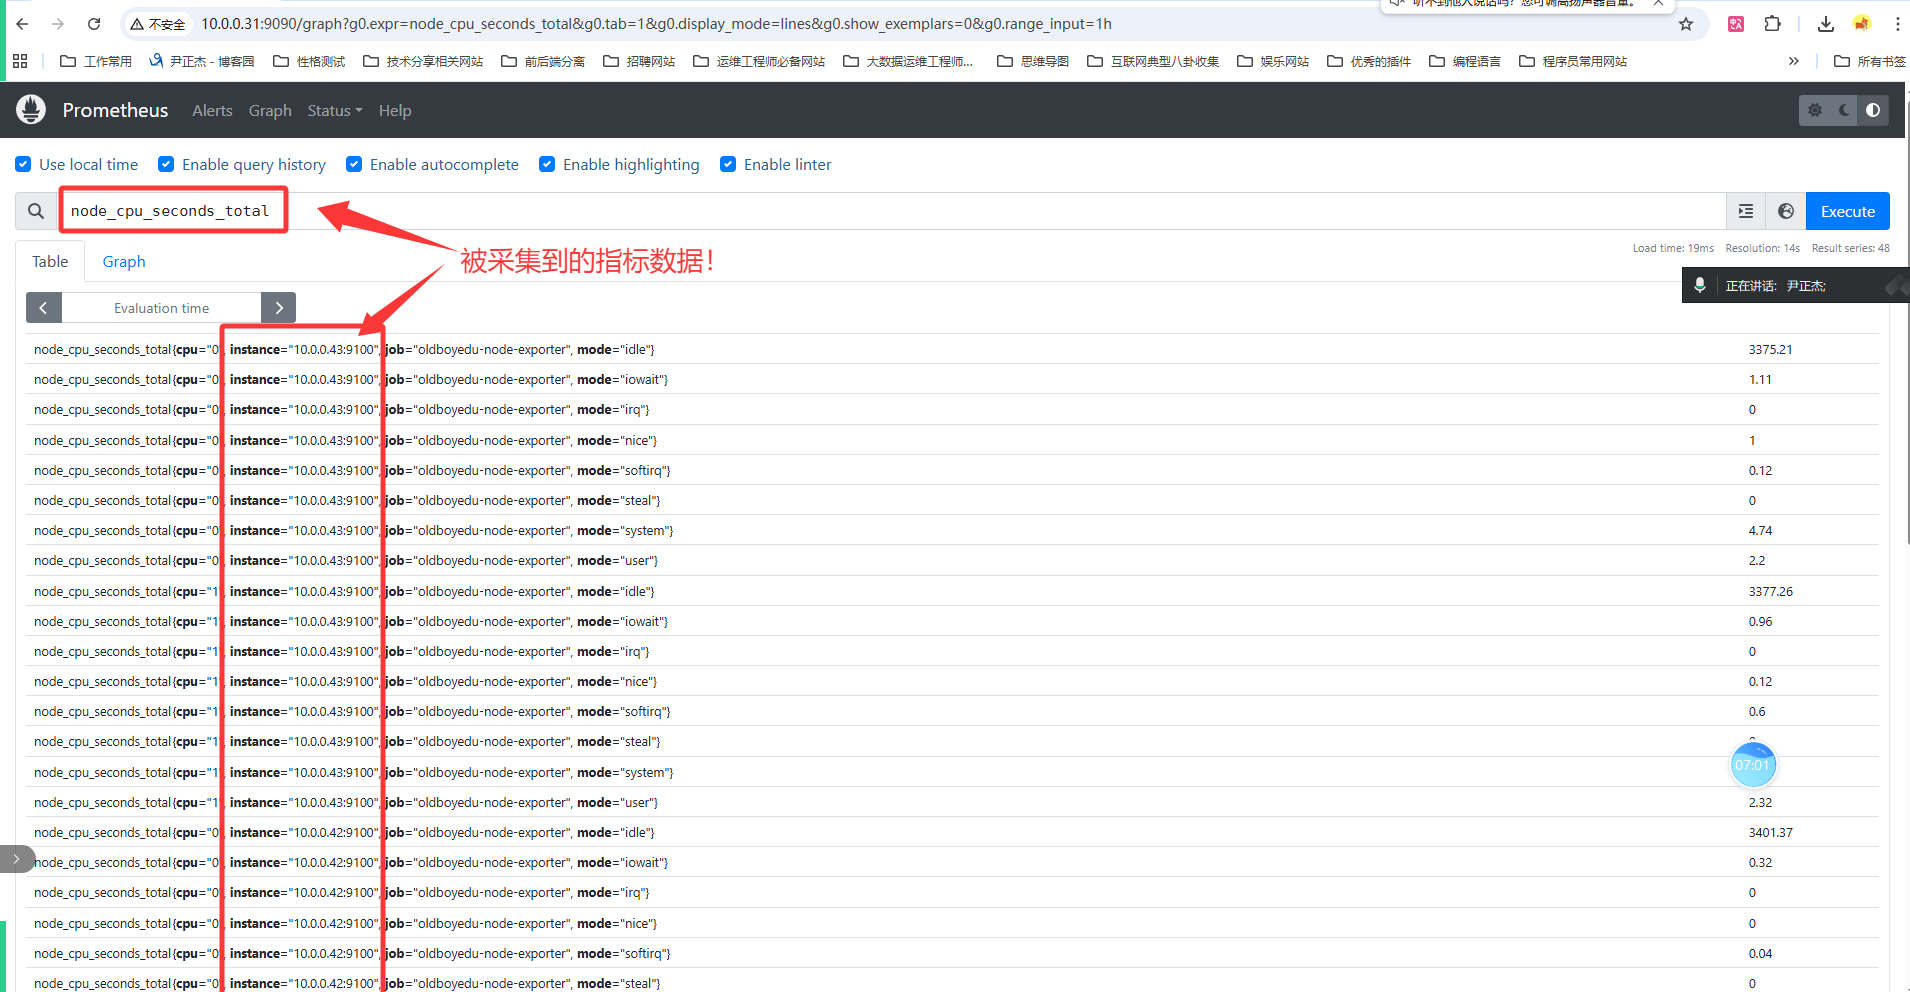
四、PromQL语句
4.1 Prometheus数据类型

|
类型 |
说明 |
示例 |
常用场景 |
|
gauge |
当前值,所见即所得 |
|
CPU使用率、内存使用率 |
|
counter |
单调递增计数器 |
|
请求总数、错误总数 |
|
histogram |
直方图样本观测 |
|
请求延迟分布、分位值 |
|
summary |
预计算的分位值 |
|
预聚合的延迟统计 |
数据类型详解
1. gauge(仪表盘)
# 查询节点启动时间(当前值)
node_boot_time_seconds

# 查询Go版本信息(标签更有意义)
go_info
2. counter(计数器)
# 查询QPS(每秒请求数)
rate(prometheus_http_requests_total[1m])

# 查询增量(1分钟内的请求增量)
increase(prometheus_http_requests_total[1m])

# 查询平均访问时间
prometheus_http_request_duration_seconds_sum / prometheus_http_request_duration_seconds_count
3. histogram(直方图)- 分位值查询
# 查询HTTP请求延迟的95分位值
histogram_quantile(0.95, sum(rate(prometheus_http_request_duration_seconds_bucket[1m])) by (le))

# 查询特定API的延迟分布
histogram_quantile(0.95, sum(rate(prometheus_http_request_duration_seconds_bucket{handler="/api/v1/query"}[5m])) by (le))
为什么需要分位值?
平均值会掩盖短时故障。例如:5分钟故障在24小时平均后可能被忽略,而分位值能及时发现短时异常。
4.2 PromQL操作符
# 1. 精确匹配
node_cpu_seconds_total{instance="10.0.0.42:9100", cpu="1"}

# 2. 正则匹配(=~)
node_cpu_seconds_total{instance="10.0.0.42:9100", cpu="1", mode=~"i.*"}

# 3. 取反操作(!=, !~)
node_cpu_seconds_total{instance="10.0.0.42:9100", cpu!="1", mode=~"i.*"}

# 4. 算数运算
100 / 5
10 + 20
4.3 常用函数
# 1. 计算CPU使用率(压力测试演示)
# 在42节点执行压力测试
apt -y install stress
stress --cpu 8 --io 4 --vm 2 --vm-bytes 128M --timeout 20m

# CPU使用率计算公式
(1 - sum(increase(node_cpu_seconds_total{mode="idle"}[1m])) by (instance)
  / sum(increase(node_cpu_seconds_total[1m])) by (instance)) * 100

# 2. 计算节点运行时间(分钟)
(time() - node_boot_time_seconds) / 60参考链接:
- 操作符:https://prometheus.io/docs/prometheus/latest/querying/operators/
- 函数:https://prometheus.io/docs/prometheus/latest/querying/functions/
4.4 Prometheus WebUI痛点
|
痛点 |
说明 |
|
临时性 |
查询数据是临时的,关闭页面后不保存 |
|
学习成本高 |
需要学习PromQL语法,对新手不友好 |
解决方案:使用Grafana进行可视化展示
五、Grafana图形化展示
5.1 Grafana安装
# 1. 安装依赖包
apt-get install -y adduser libfontconfig1 musl

# 2. 下载Grafana
wget https://dl.grafana.com/enterprise/release/grafana-enterprise_9.5.21_amd64.deb

# 3. 安装
dpkg -i grafana-enterprise_9.5.21_amd64.deb

# 4. 启动Grafana
systemctl enable --now grafana-server

# 5. 验证端口
ss -ntl | grep 3000

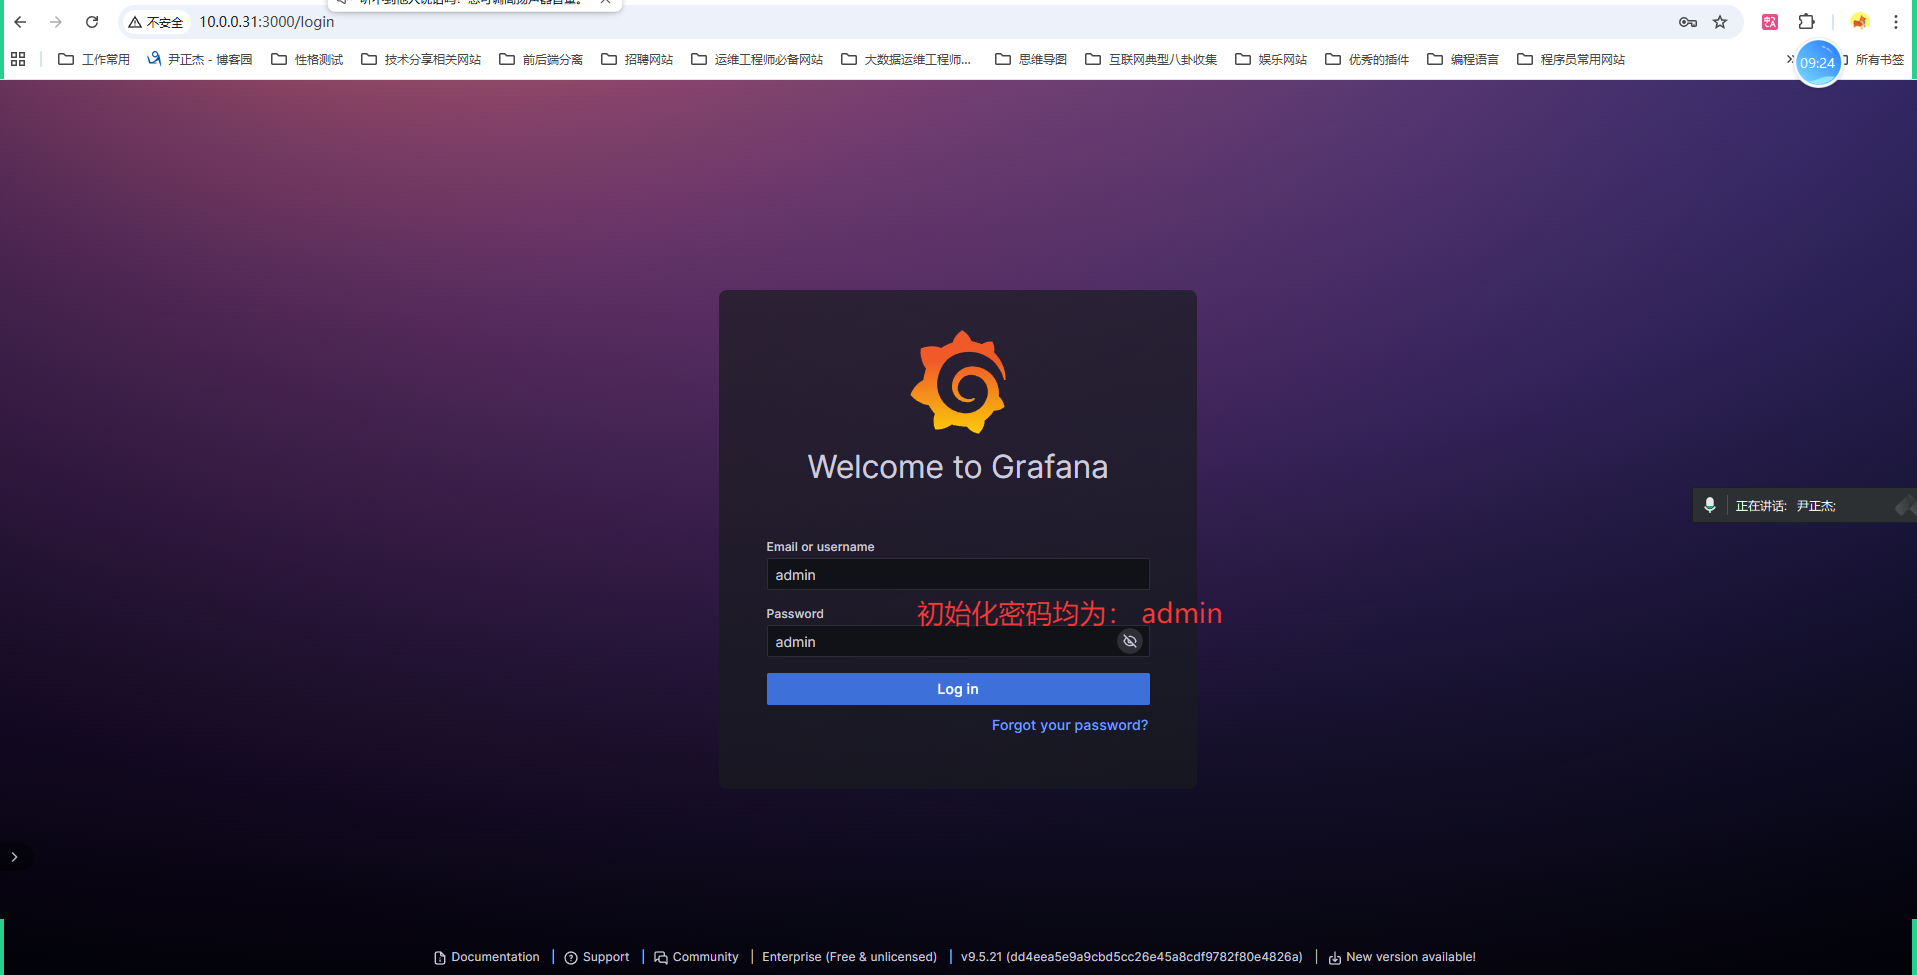
# 6. 访问WebUI
http://10.0.0.31:3000/
# 默认用户名/密码:admin/admin
5.2 配置Prometheus数据源
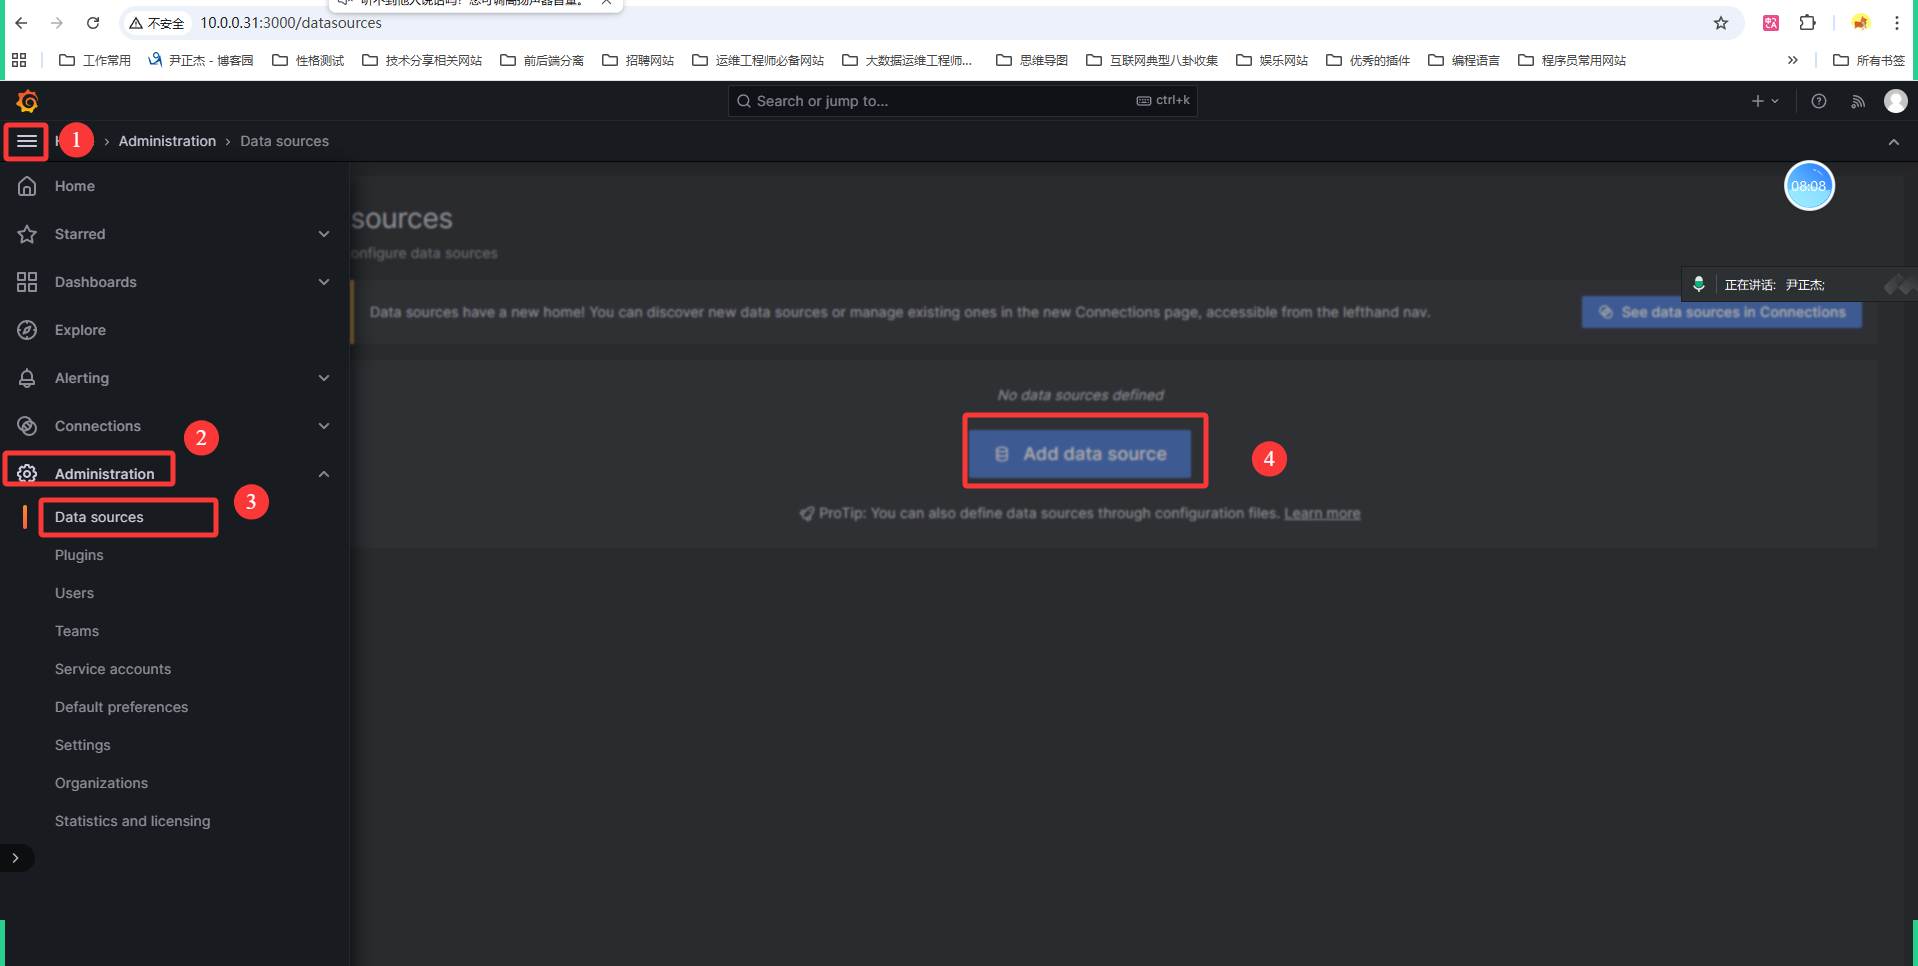
1. 登录Grafana(首次登录需修改密码,可跳过)
2. 点击左侧菜单"Configuration" → "Data Sources"
3. 点击"Add data source" → 选择"Prometheus"
4. 配置URL:http://10.0.0.31:9090
5. 点击"Save & Test"
5.3 导入Dashboard模板,监控linux主机
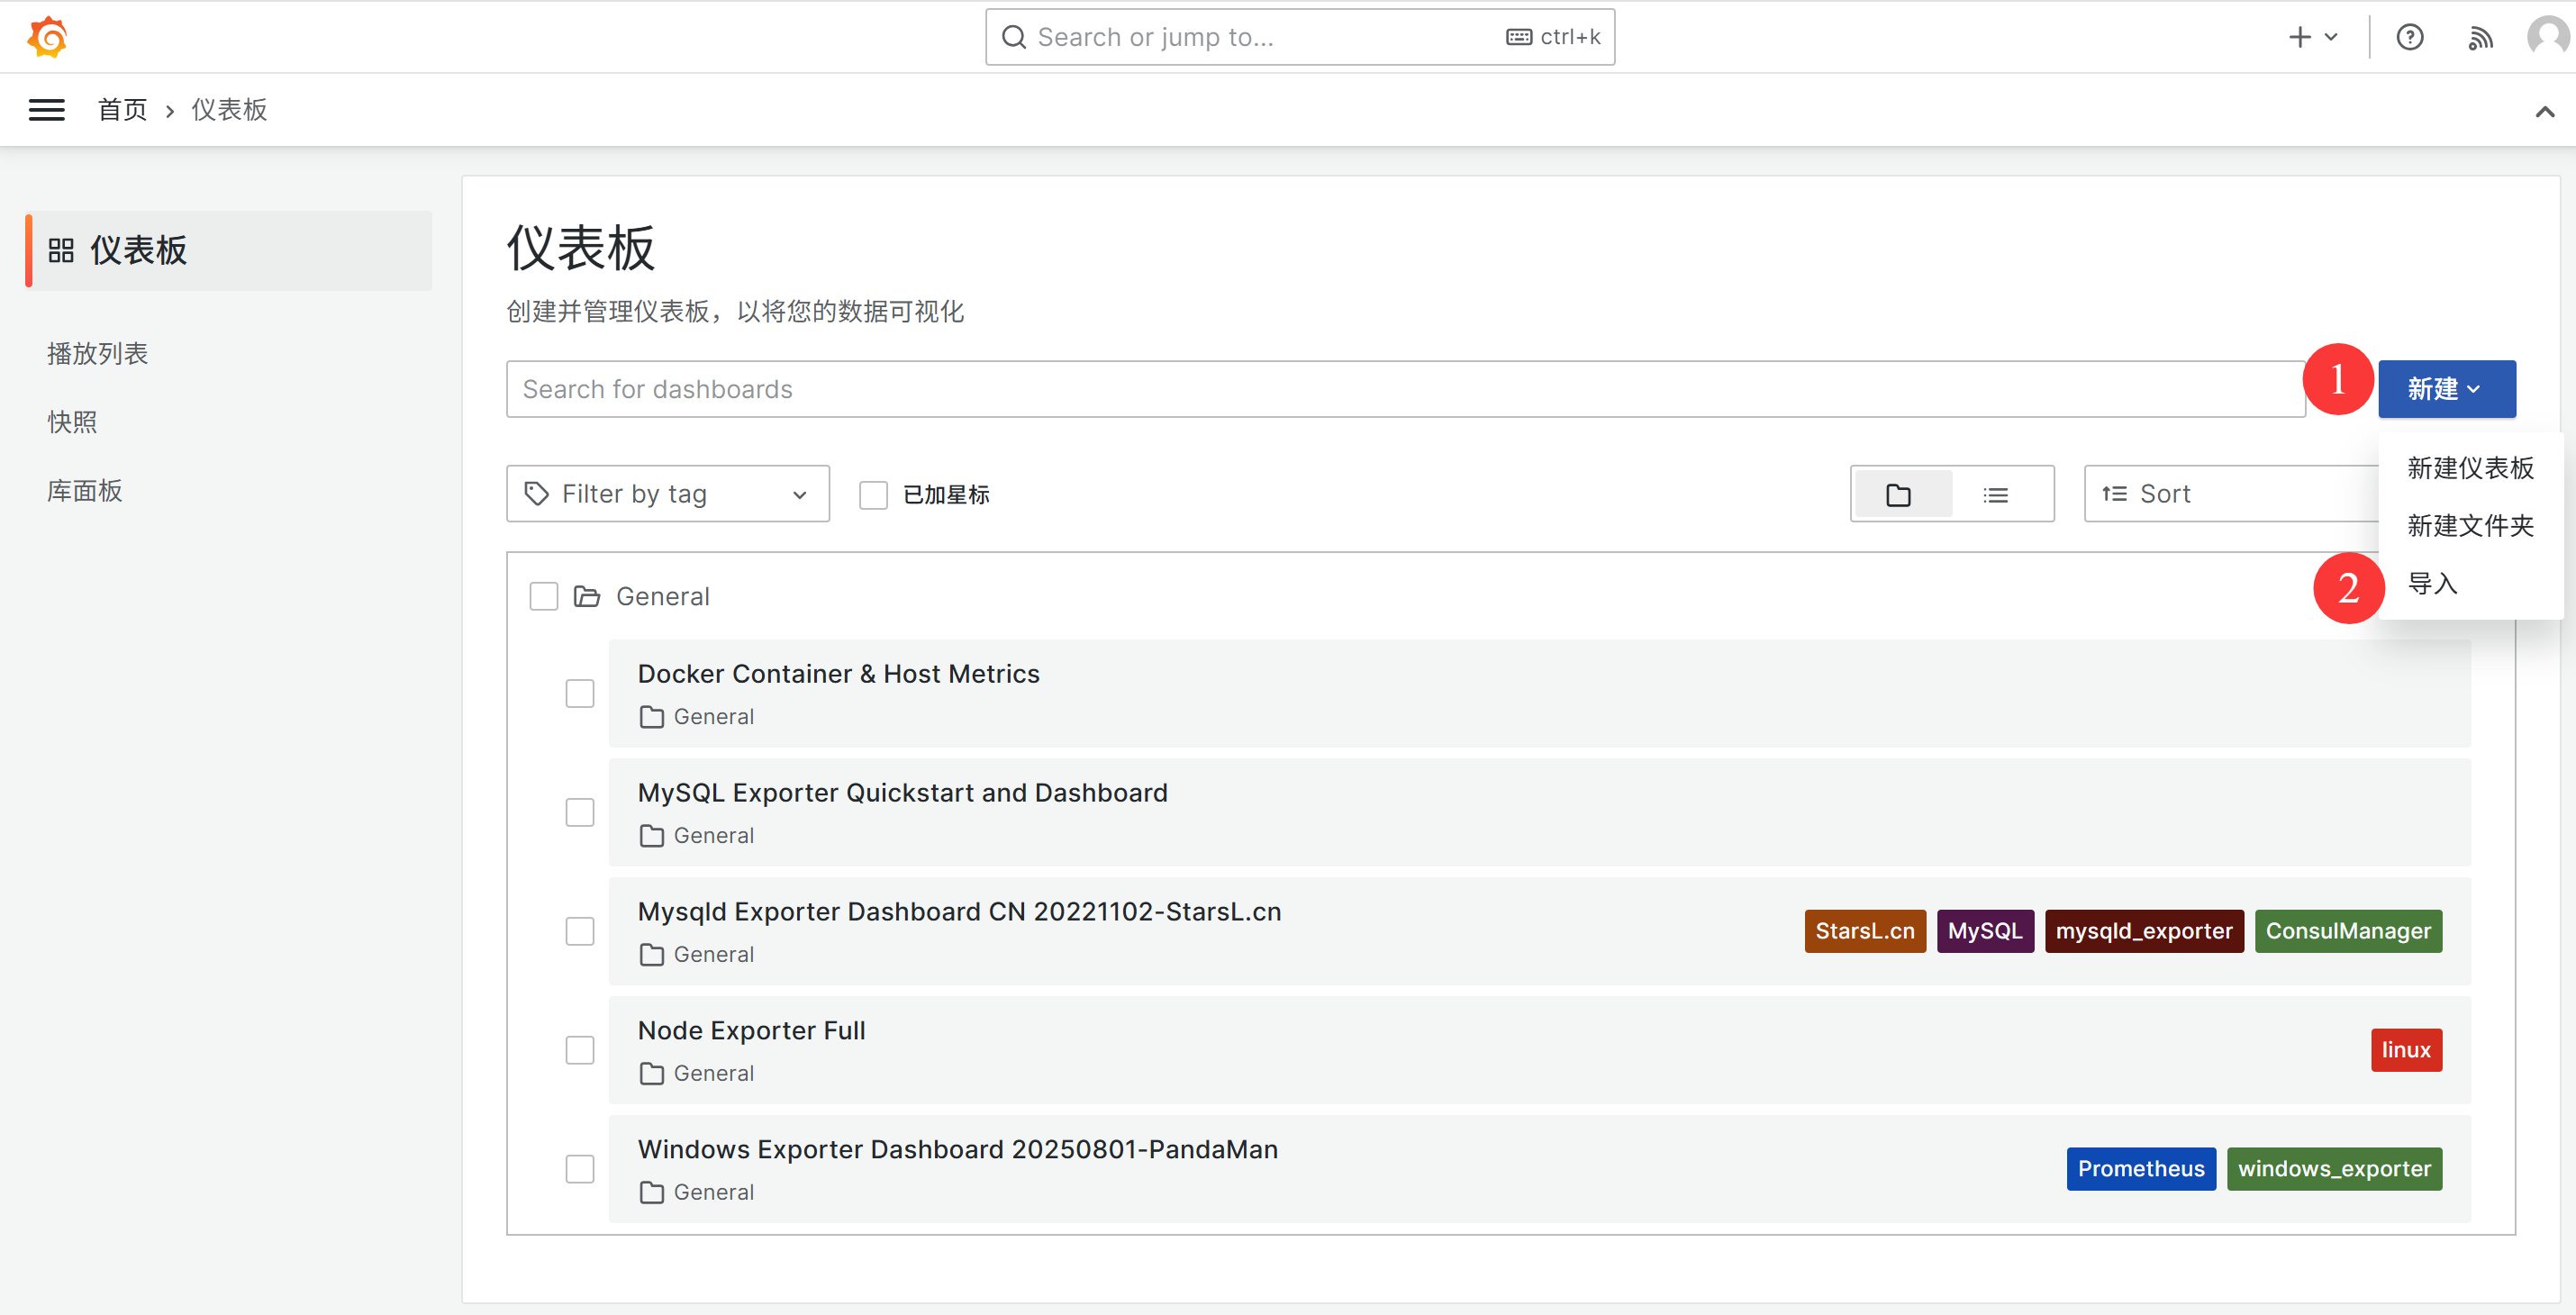
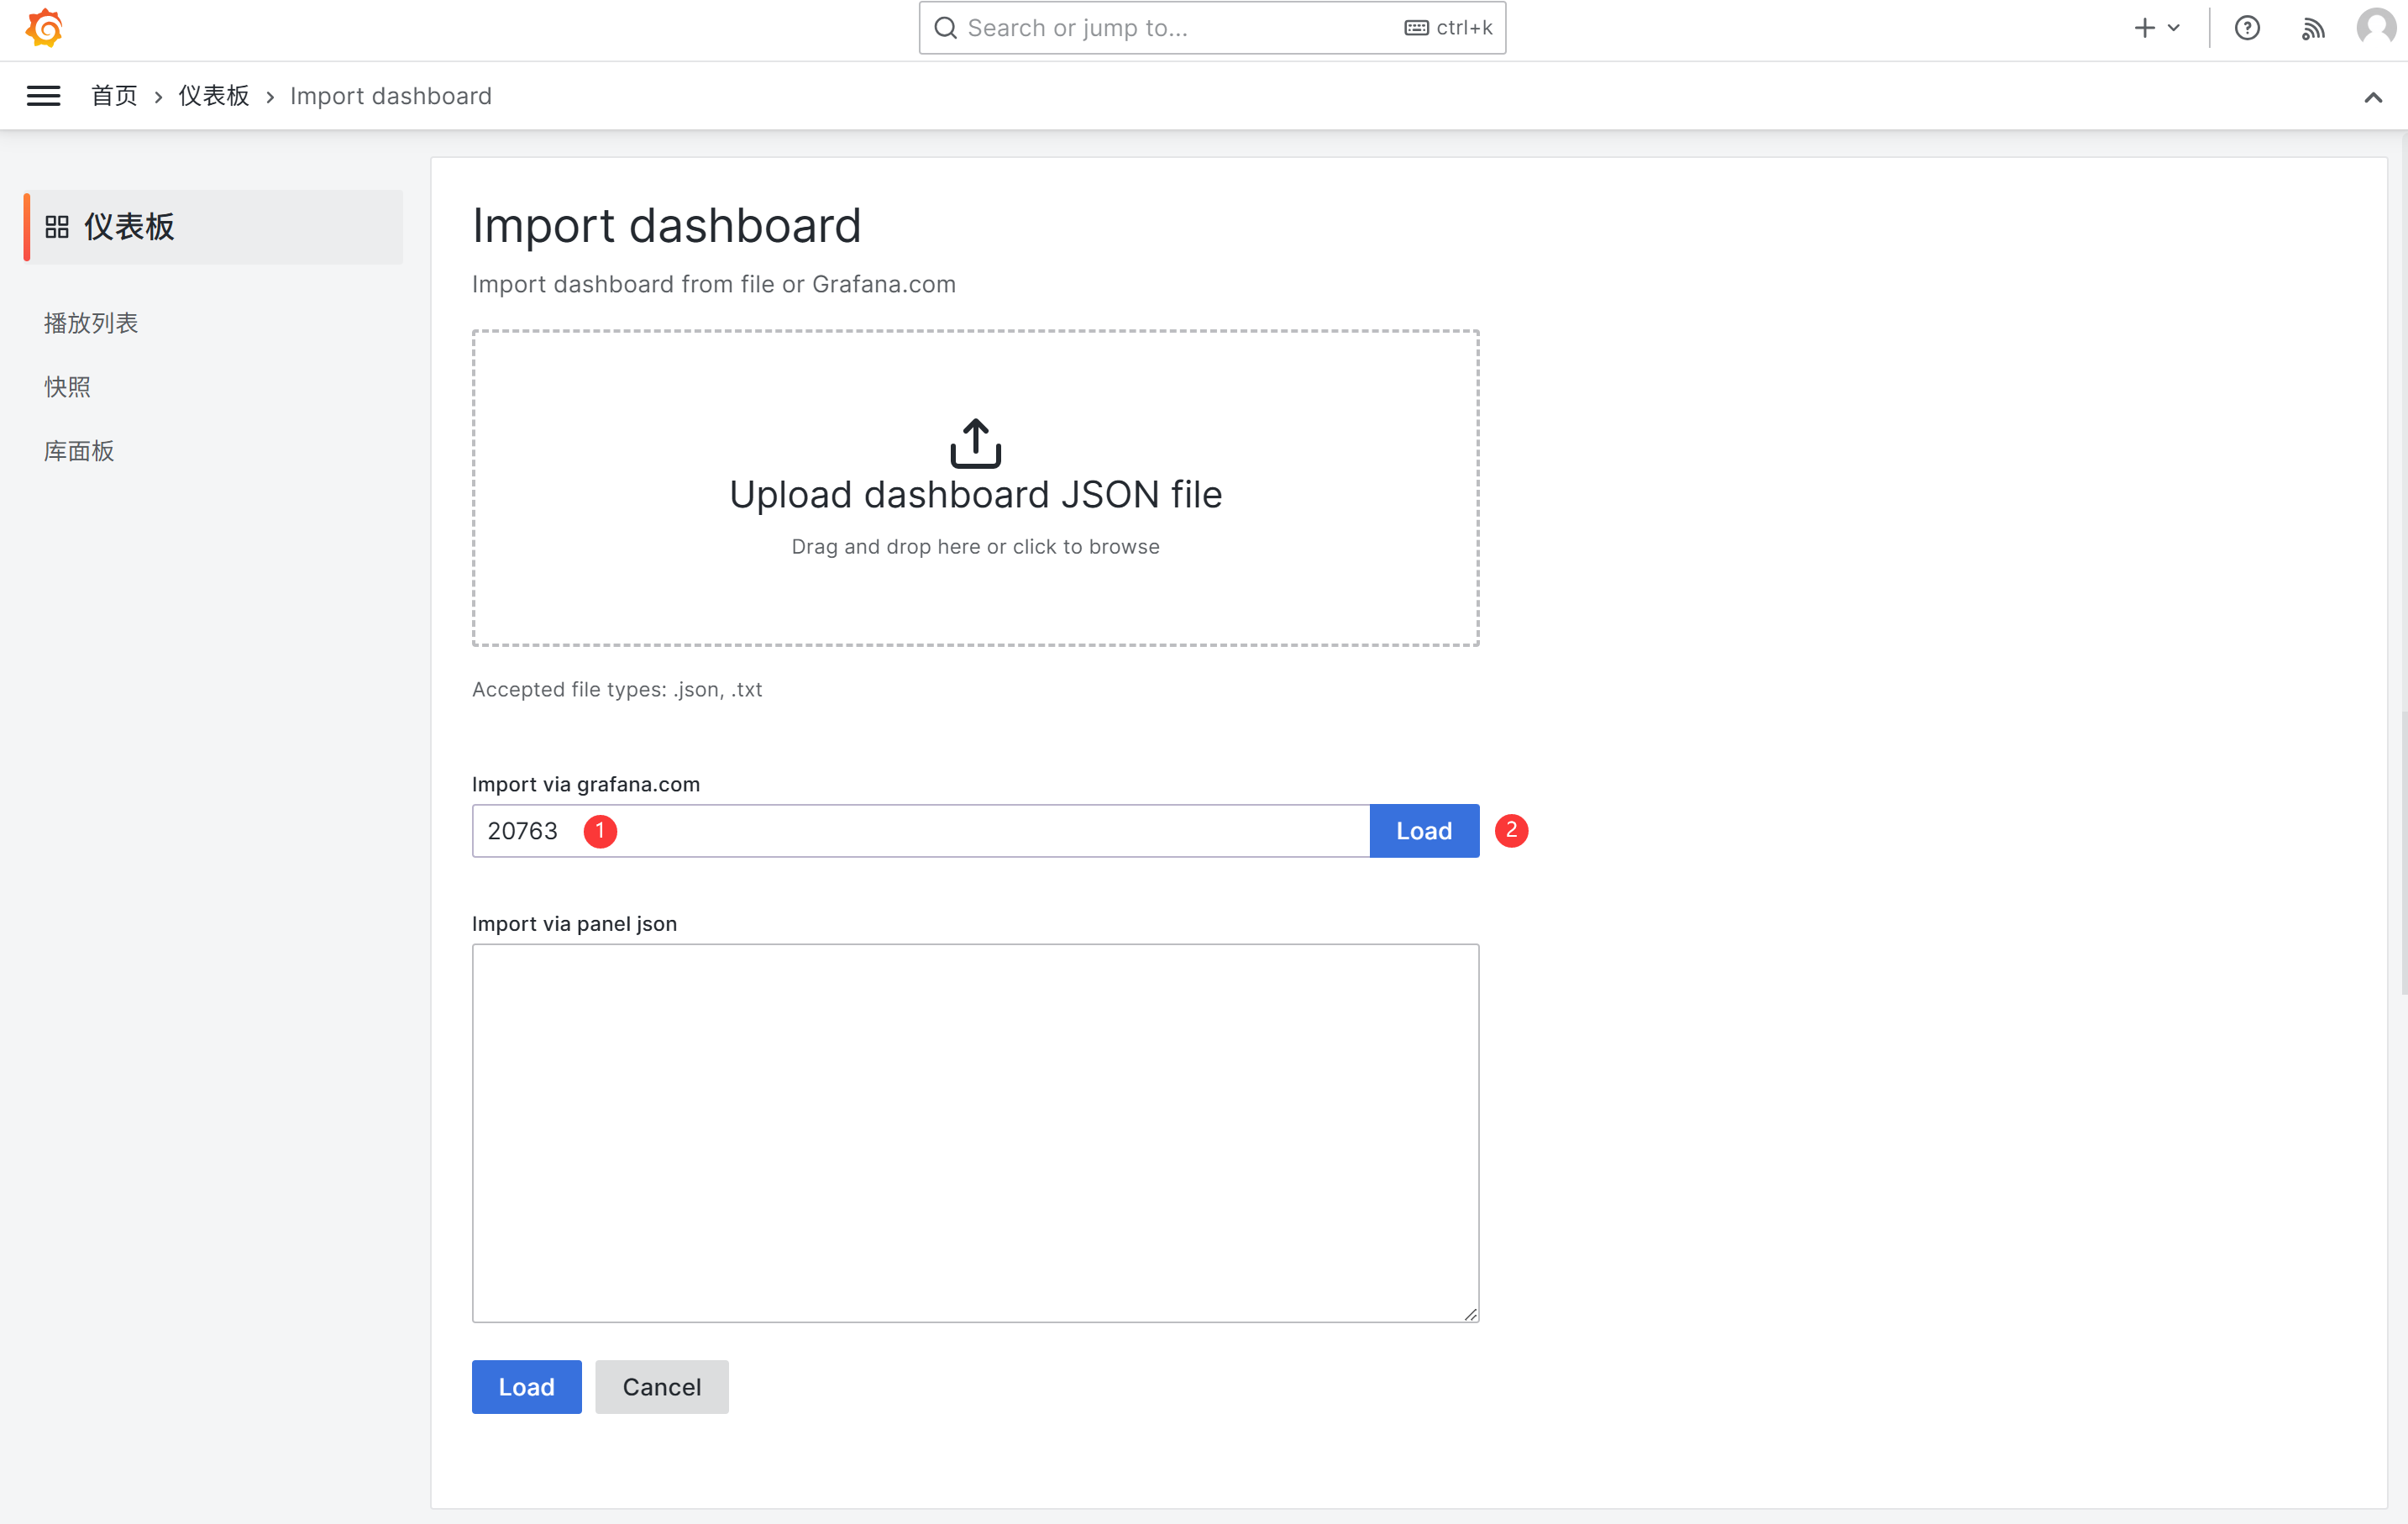
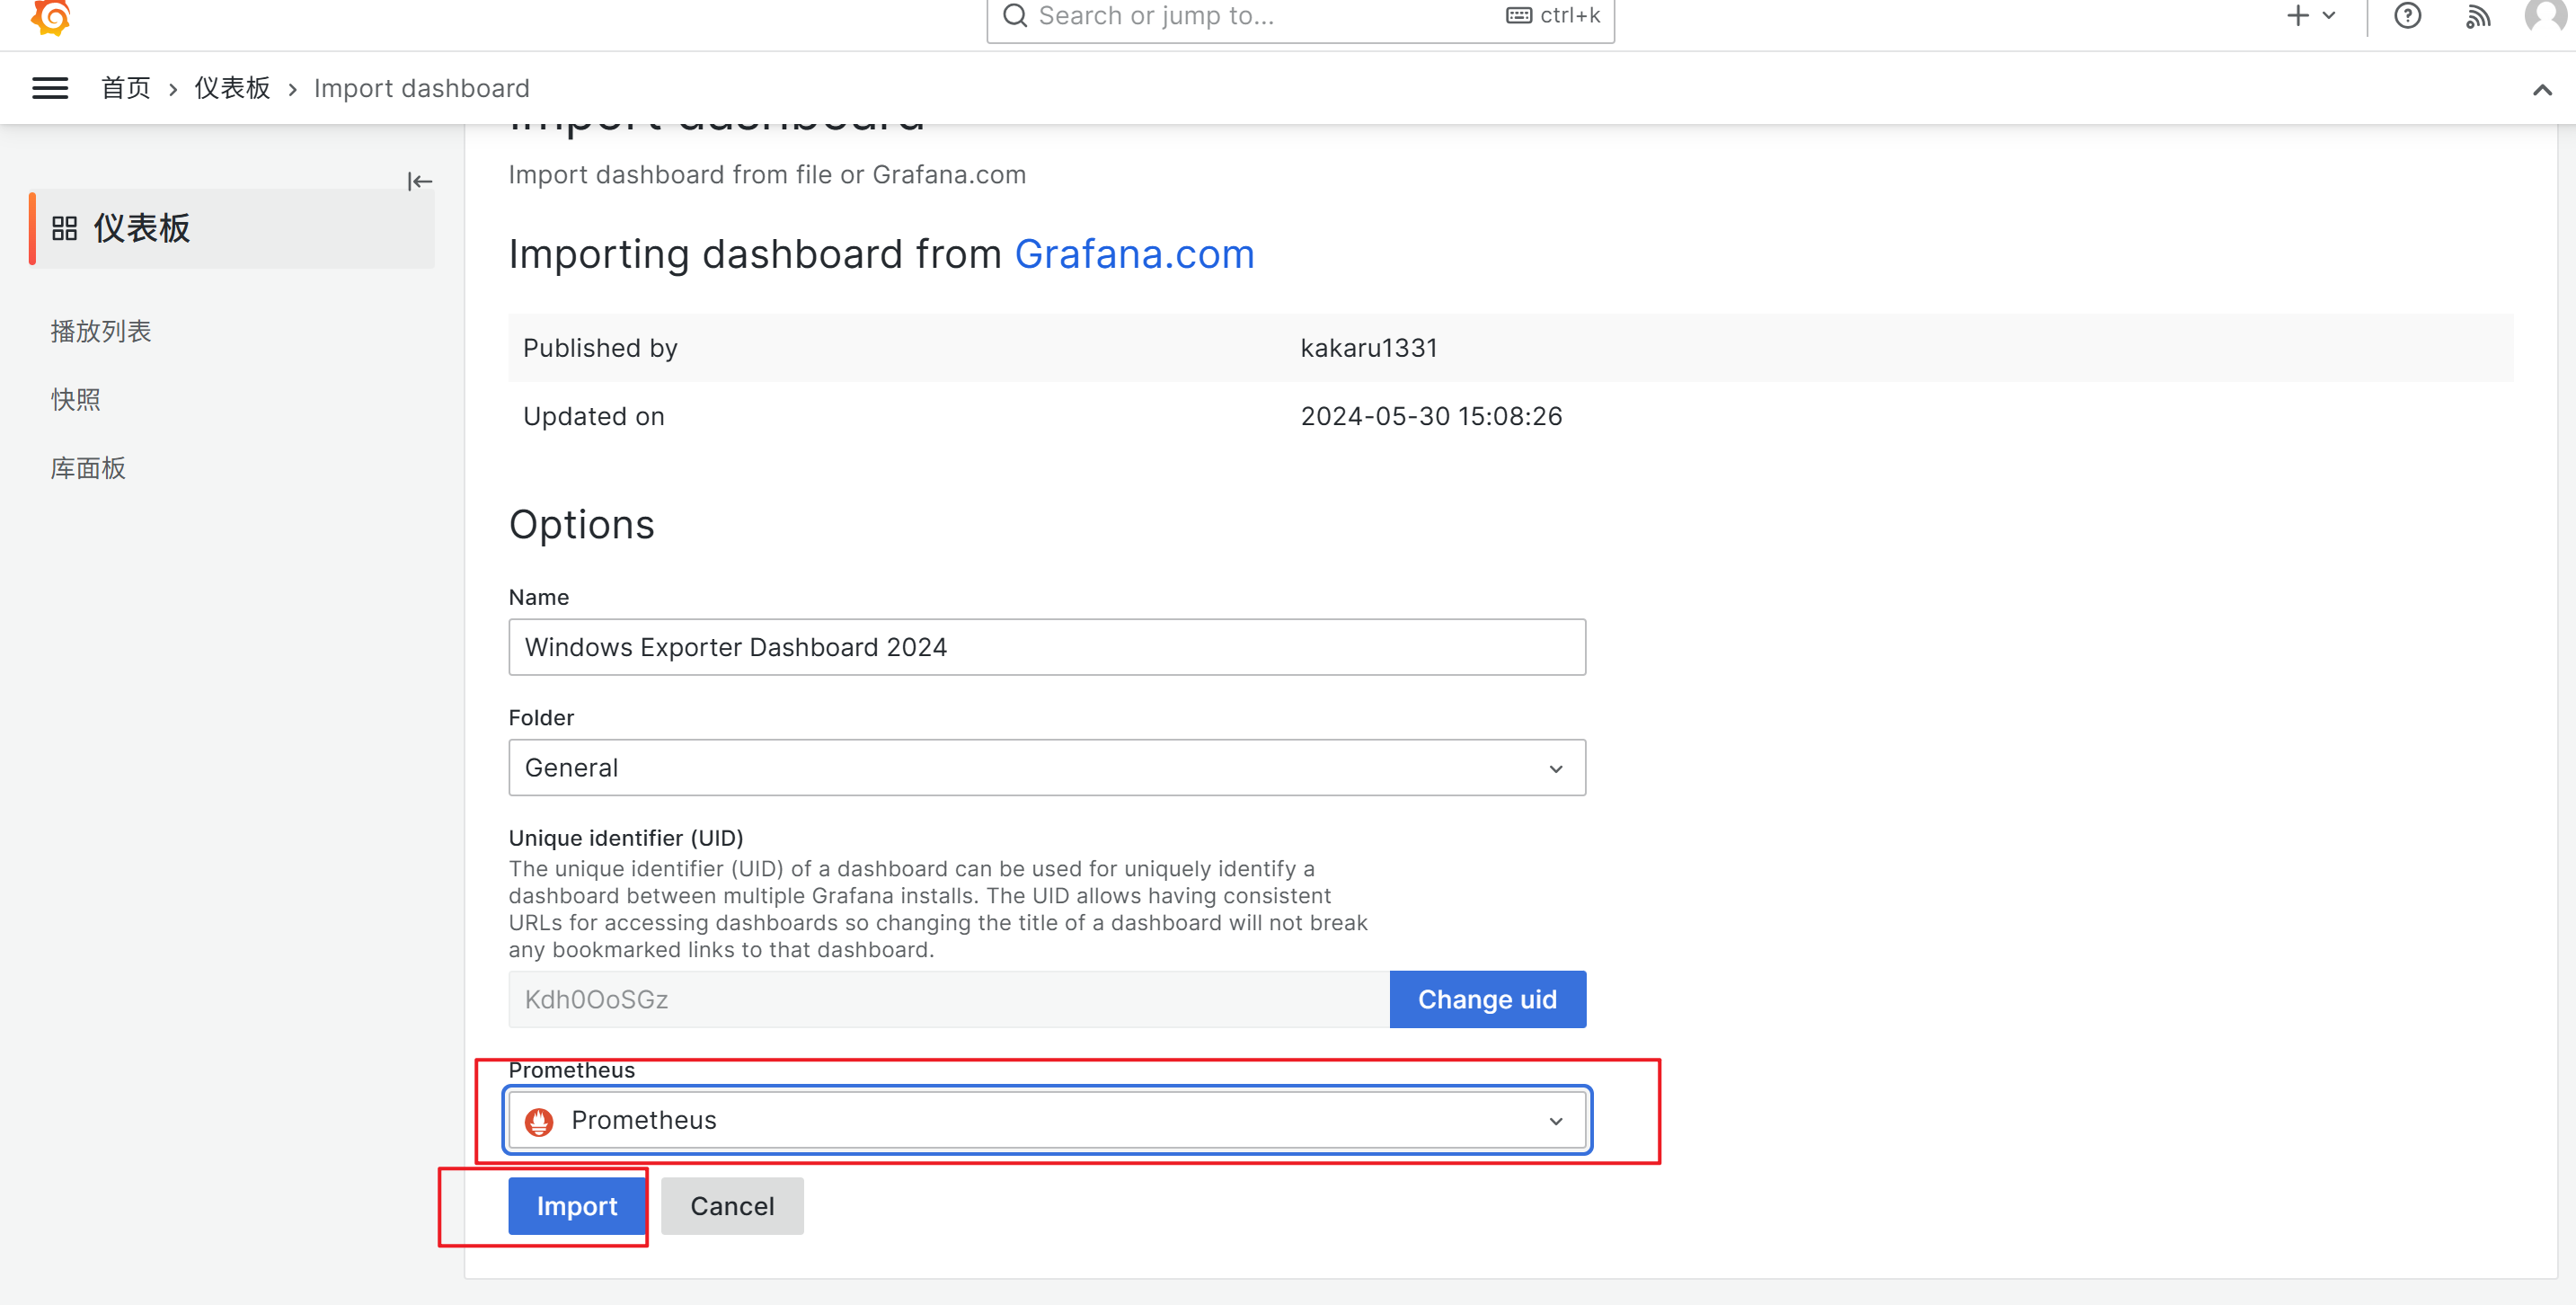
1. 点击左侧菜单"+" → "Import"
2. 输入Dashboard ID(如:1860)
3. 点击"Load"
4. 选择Prometheus数据源
5. 点击"Import"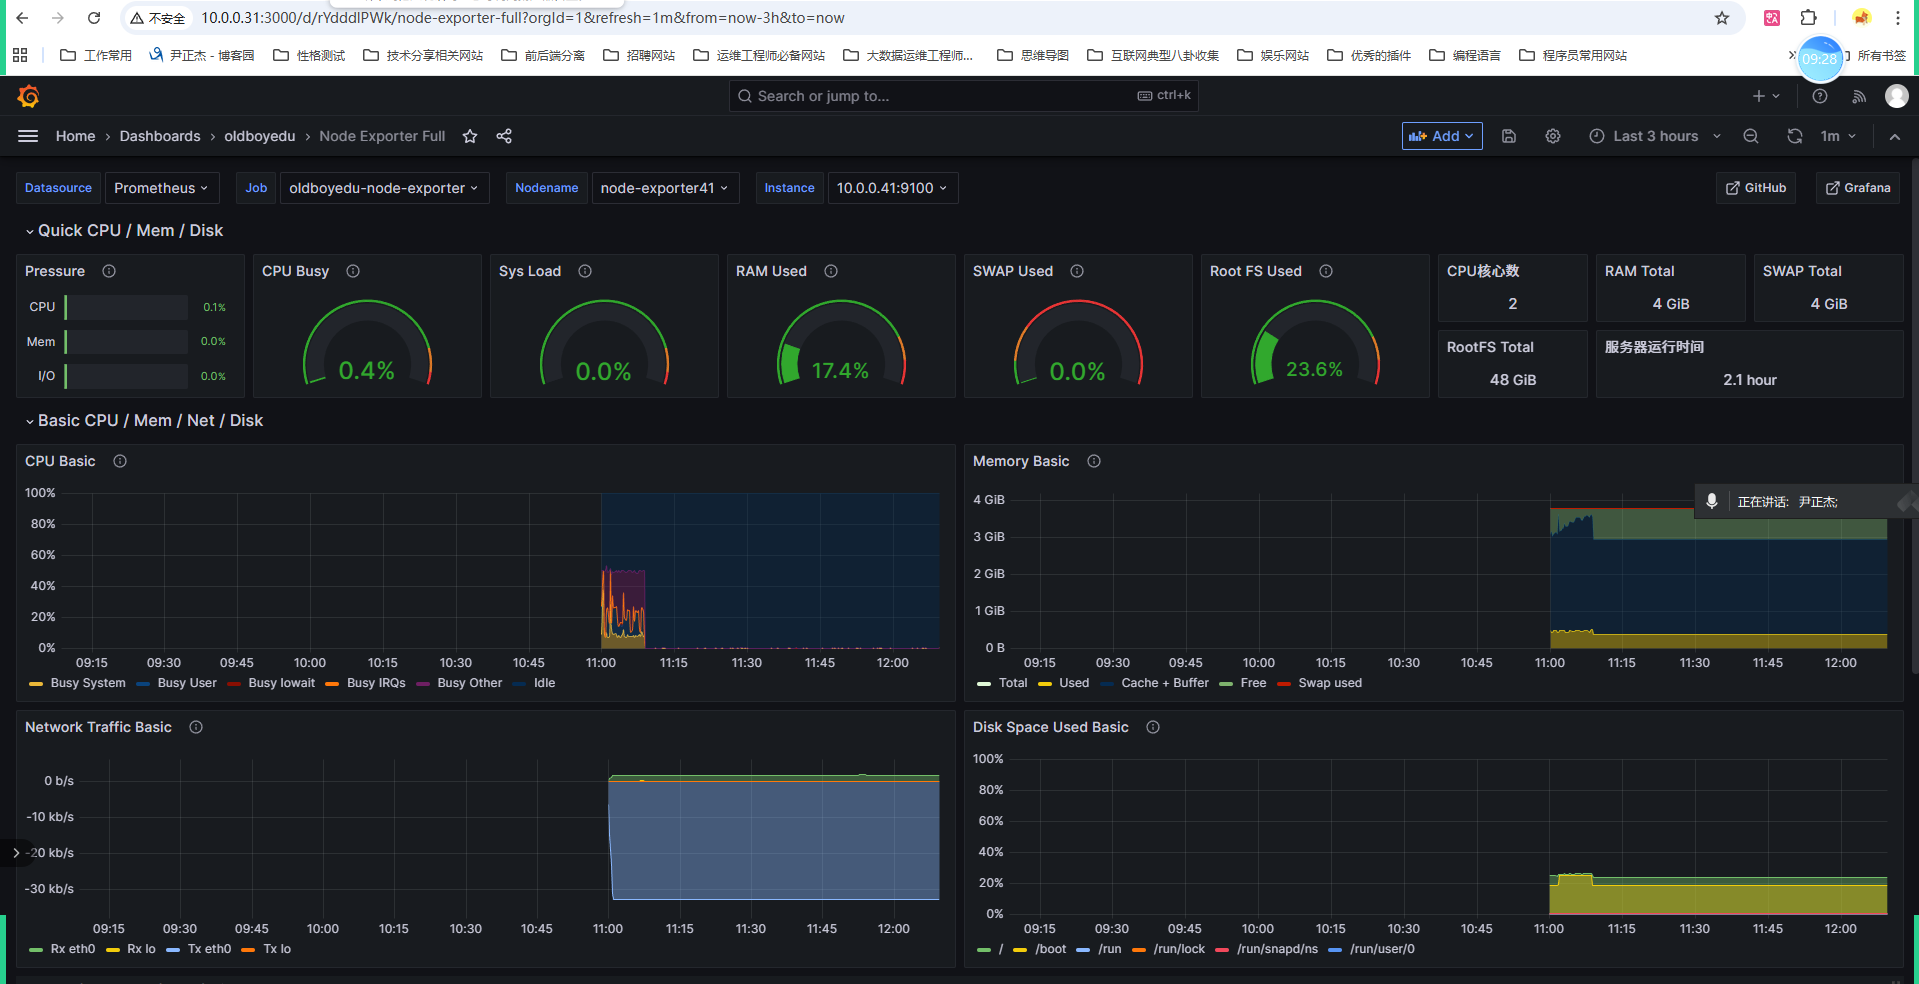
常用Dashboard模板ID
|
监控对象 |
Dashboard ID |
|
Linux节点(Node Exporter) |
1860 |
|
Windows主机 |
23847、14694、20763 |
|
Docker容器(cAdvisor) |
10619 |
|
MySQL |
14057、17320 |
模板查询站点:https://grafana.com/grafana/dashboards
六、Prometheus监控主流中间件
6.1 监控Windows主机
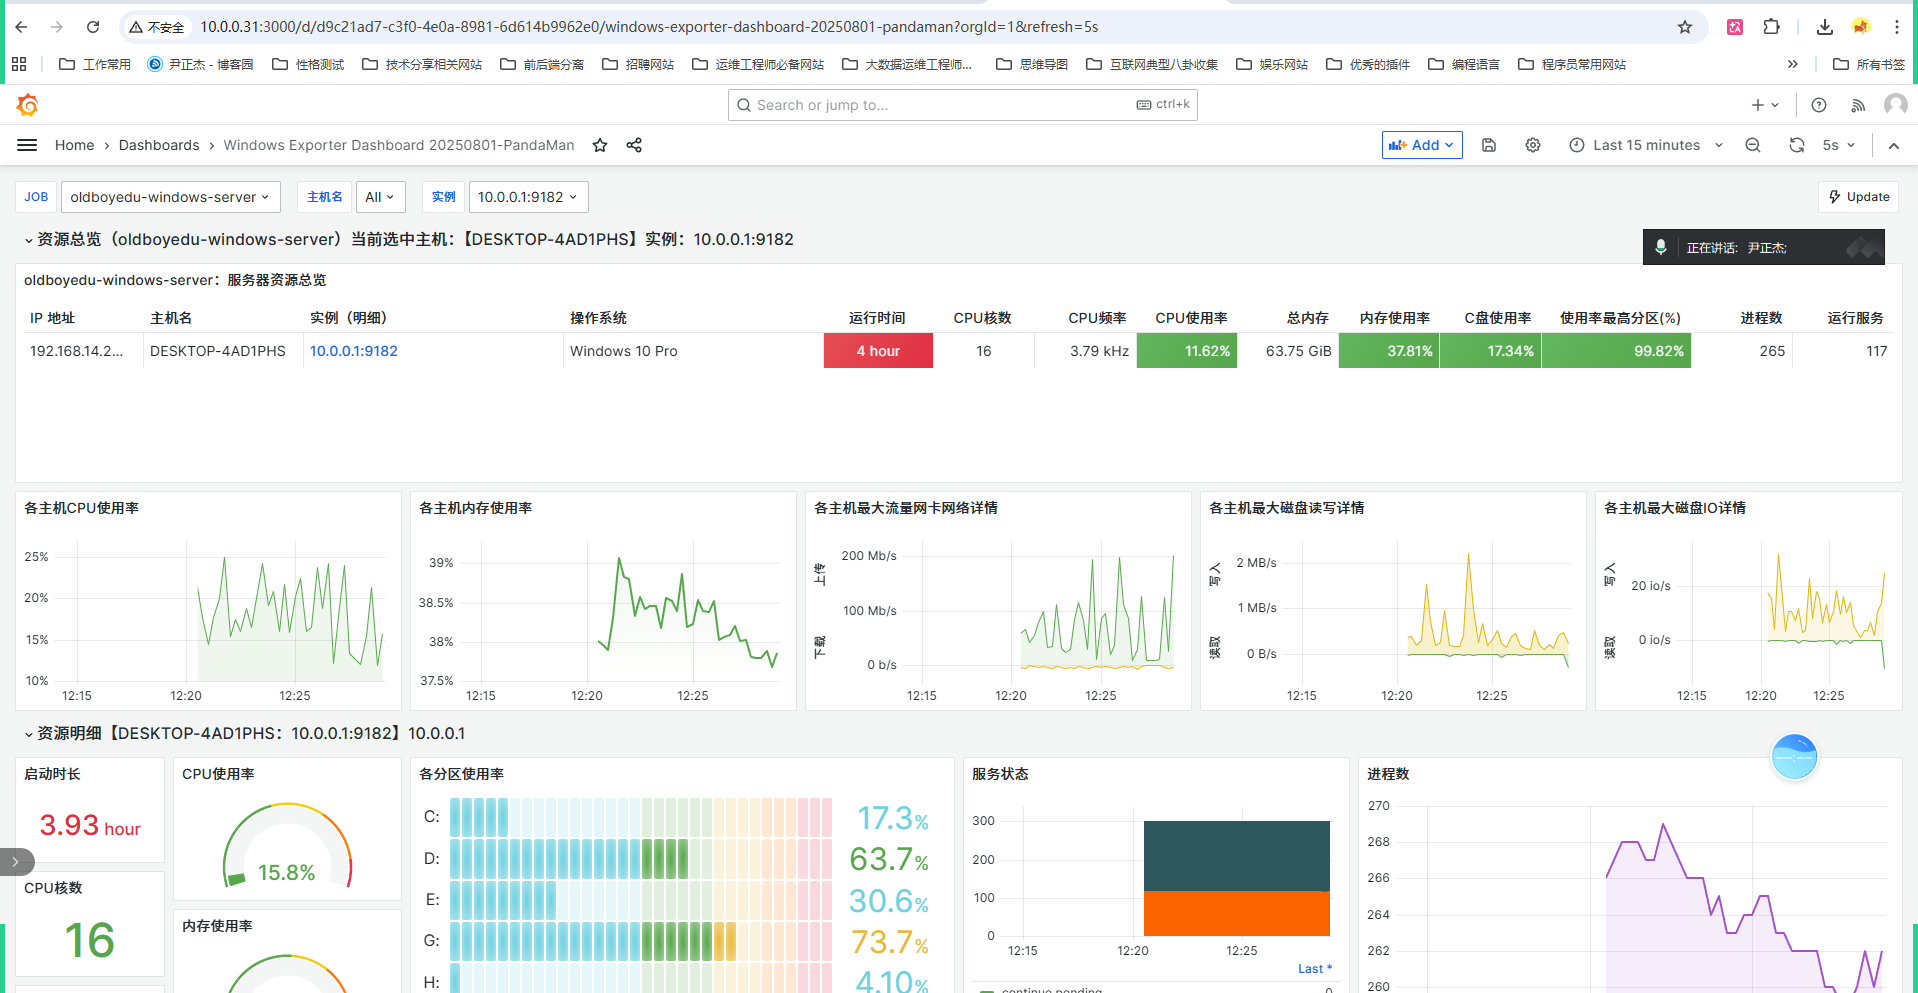
# 1. 下载windows_exporter
# 下载地址:https://github.com/prometheus-community/windows_exporter/releases/download/v0.31.5/windows_exporter-0.31.5-amd64.exe

# 2. 在Windows主机运行(cmd窗口)
windows_exporter-0.31.3-amd64.exe

# 3. 验证metrics
http://10.0.0.1:9182/metrics

# 4. Prometheus配置
vim prometheus.yml
- job_name: "oldboyedu-windows-exporter"
static_configs:
- targets: ["10.0.0.1:9182"]# 5. 热加载
curl -X POST 10.0.0.31:9090/-/reload好用的模版ID
23847
14694
20763
6.2 监控Docker容器(cAdvisor)
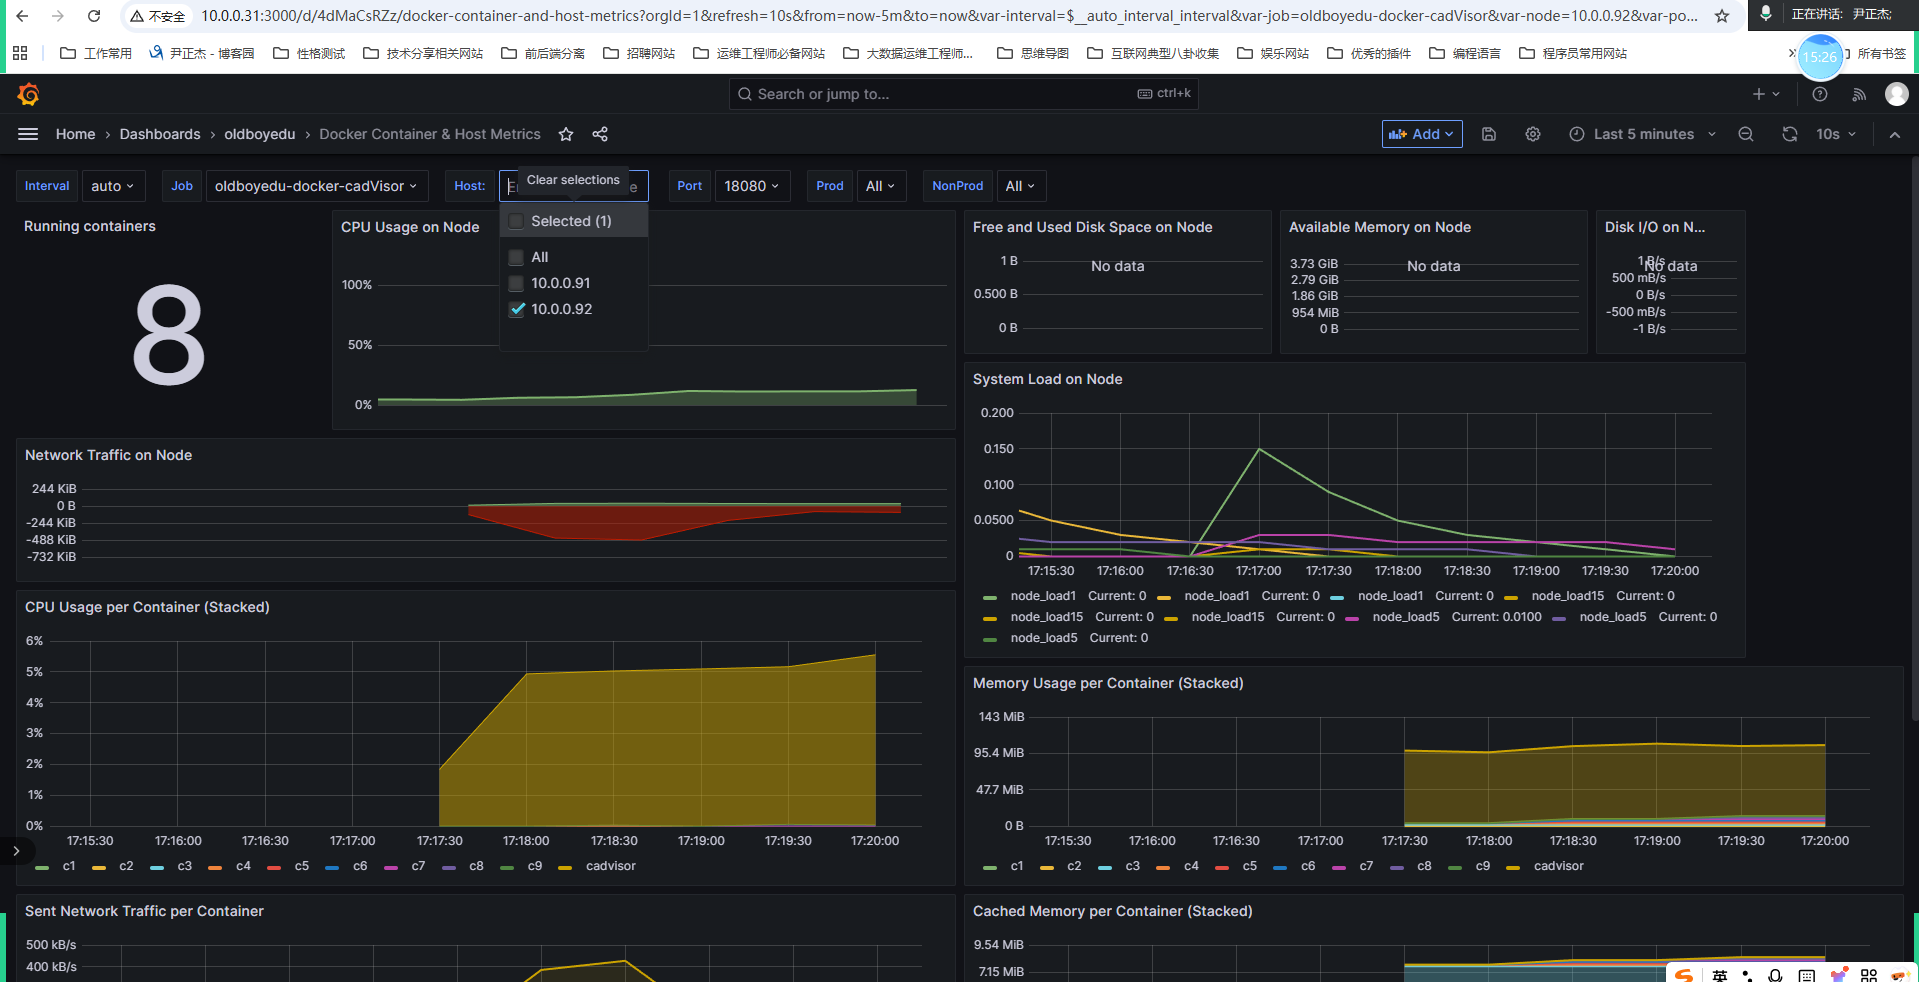
cAdvisor:Google开源的工具,用于监控容器资源使用情况。
# 参考链接
https://github.com/google/cadvisor

# 1. 导入cAdvisor镜像
wget http://192.168.16.253/Resources/Prometheus/images/cAdvisor/oldboyedu-cadvisor-v0.52.1.tar.gz
docker load -i oldboyedu-cadvisor-v0.52.1.tar.gz

# 2. 运行测试容器
docker run -id --name c1 alpine:3.20.2
docker run -id --name c2 alpine:3.20.2

# 3. 运行cAdvisor容器
docker run \
  --volume=/:/rootfs:ro \
  --volume=/var/run:/var/run:ro \
  --volume=/sys:/sys:ro \
  --volume=/var/lib/docker/:/var/lib/docker:ro \
  --volume=/dev/disk/:/dev/disk:ro \
  -p 18080:8080 \
  --detach=true \
  --name=cadvisor \
  --privileged \
  --device=/dev/kmsg \
  gcr.io/cadvisor/cadvisor-amd64:v0.52.1

# 4. 访问cAdvisor WebUI
http://10.0.0.41:18080/docker/
http://10.0.0.42:18080/docker/

# 5. Prometheus配置
[root@prometheus-server31 ~]# vim /oldboyedu/softwares/prometheus-2.53.4.linux-amd64/prometheus.yml
# 添加
- job_name: "oldboyedu-docker-cadVisor"
  static_configs:
    - targets: ["10.0.0.41:18080", "10.0.0.42:18080"]
# 6. 热加载
curl -X POST 10.0.0.31:9090/-/reload
# 7. Grafana导入Dashboard 10619cAdvisor Dashboard优化(如果容器数量数据无法正常显示):
|
优化项 |
操作 |
|
PromQL优化 |
|
|
Value options |
将'Calculation'字段设置为'Last *' |
|
保存Dashboard |
刷新页面后需重新保存 |
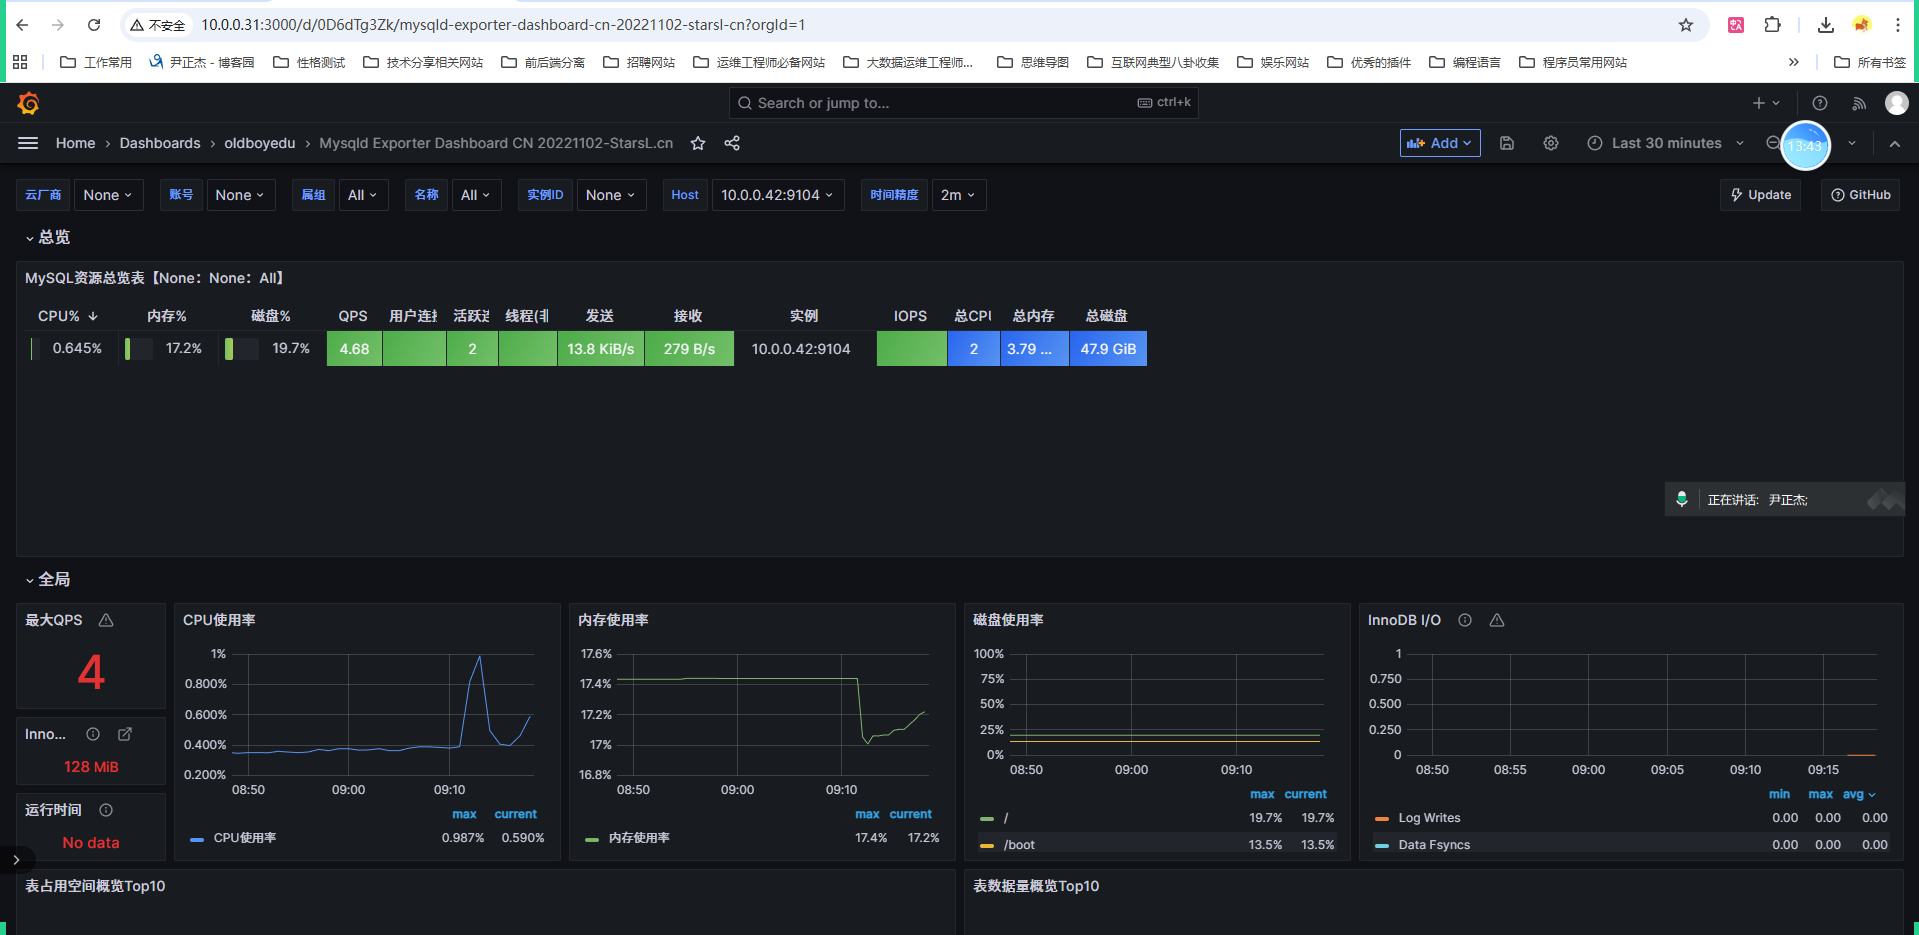
6.3 监控MySQL
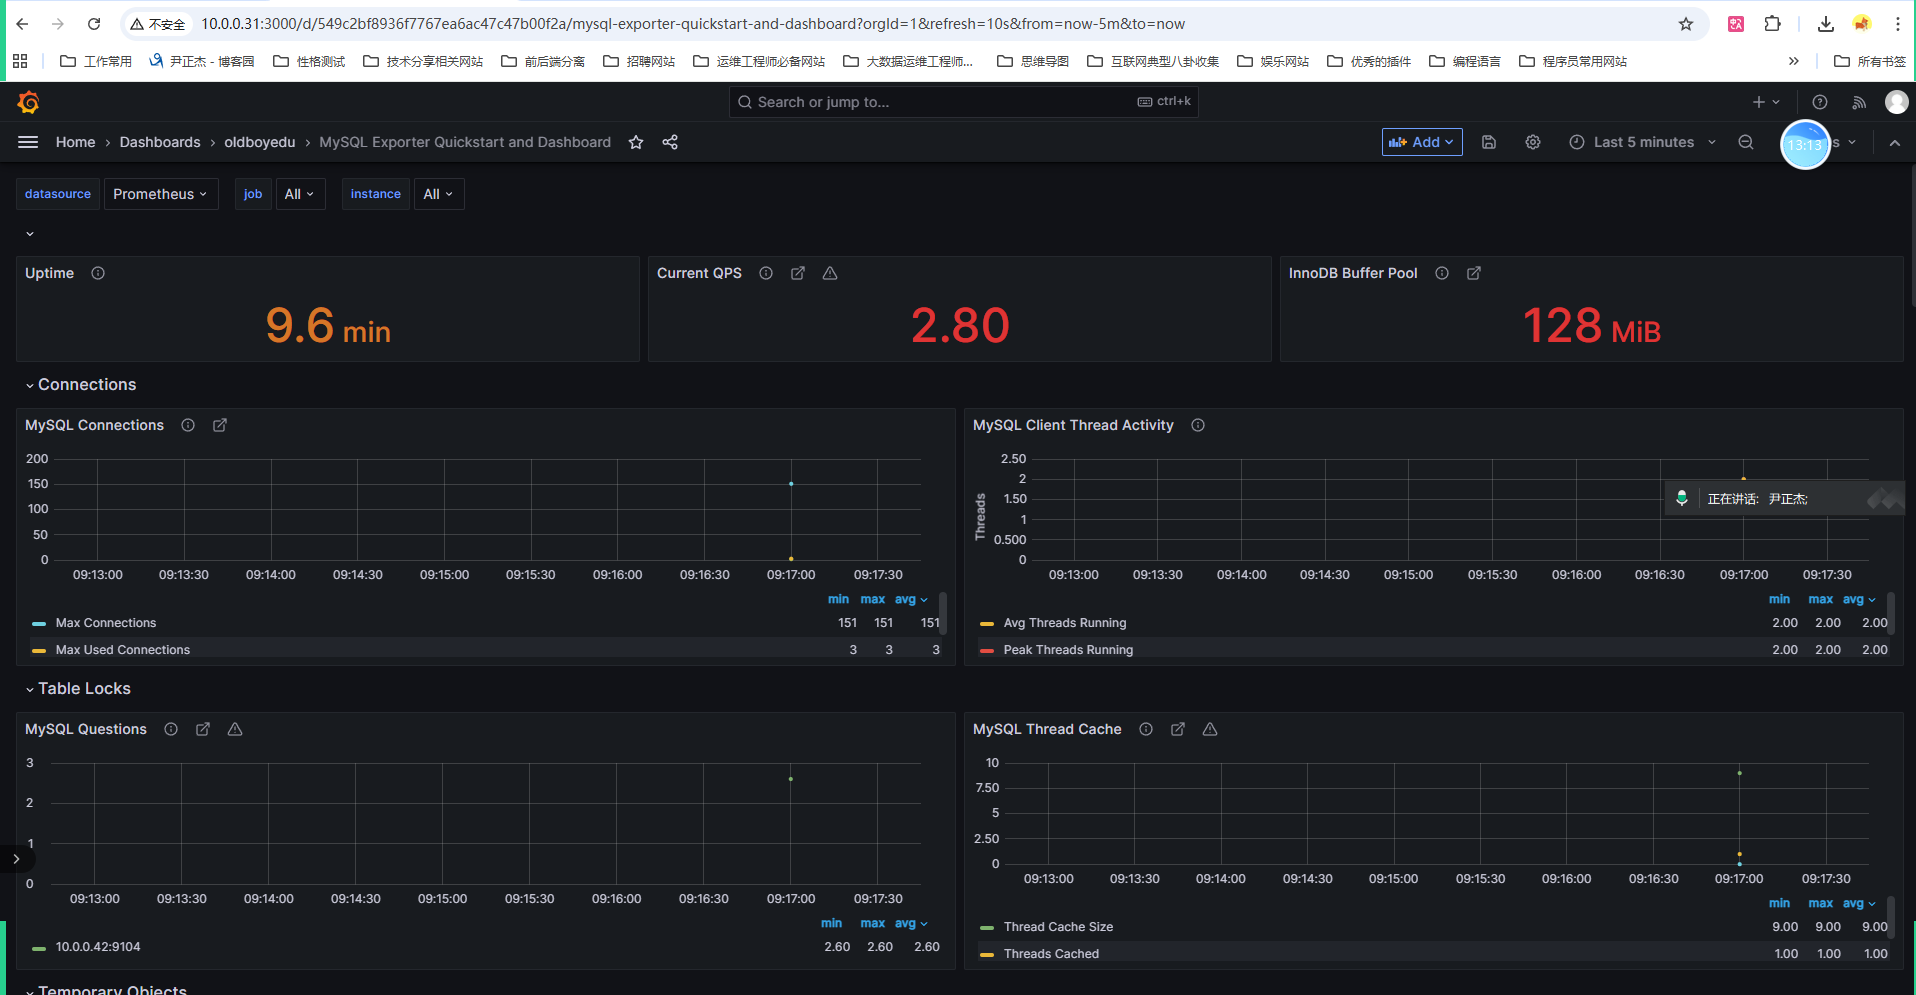
# 1. 导入MySQL镜像,在10.0.0.41
wget http://192.168.16.253/Resources/Docker/images/WordPress/oldboyedu-mysql-v8.0.36-oracle.tar.gz
docker load  < oldboyedu-mysql-v8.0.36-oracle.tar.gz

# 2. 部署MySQL容器
docker run -d \
  --network host \
  --name mysql-server \
  --restart always \
  -e MYSQL_DATABASE=prometheus \
  -e MYSQL_USER=linux103 \
  -e MYSQL_PASSWORD=yinzhengjie \
  -e MYSQL_ALLOW_EMPTY_PASSWORD=yes \
  mysql:8.0.36-oracle \
  --character-set-server=utf8 \
  --collation-server=utf8_bin \
  --default-authentication-plugin=mysql_native_password

# 3. 创建监控用户
docker exec -it mysql-server mysql
  SHOW GRANTS FOR linux103;
  # 添加权限
  GRANT PROCESS, REPLICATION CLIENT, SELECT ON *.* TO linux103;
  SHOW GRANTS FOR linux103;
-- 创建监控用户并授权
CREATE USER 'linux103'@'%' IDENTIFIED BY 'yinzhengjie';
GRANT PROCESS, REPLICATION CLIENT, SELECT ON *.* TO 'linux103'@'%';
GRANT ALL PRIVILEGES ON `prometheus`.* TO 'linux103'@'%';
FLUSH PRIVILEGES;# 3. 下载并安装mysqld_exporter 在另外一台机器这里是10.0.0.42
wget http://192.168.16.253/Resources/Prometheus/softwares/mysql_exporter/mysqld_exporter-0.19.0.linux-amd64.tar.gz
tar xf mysqld_exporter-0.19.0.linux-amd64.tar.gz -C /usr/local/bin/ \
mysqld_exporter-0.19.0.linux-amd64/mysqld_exporter --strip-components=1
# 4. 创建配置文件
cat > /root/.my.cnf << EOF
[client]
host = 10.0.0.41
port = 3306
user = linux103
password = yinzhengjie
EOF
# 5. 运行mysqld_exporter
mysqld_exporter --config.my-cnf=/root/.my.cnf
# 6. 验证metrics
curl -s http://10.0.0.42:9104/metrics | wc -l
# 输出:2569
# 7. Prometheus配置
[root@prometheus-server31 ~]# vim /oldboyedu/softwares/prometheus-2.53.4.linux-amd64/prometheus.yml - job_name: "oldboyedu-mysql-exporter"
static_configs:
- targets: ["10.0.0.42:9104"]# 8. 热加载
curl -X POST 10.0.0.31:9090/-/reload
# 9. Grafana导入Dashboard(14057、17320)七、Prometheus监控服务标准流程
┌─────────────────────────────────────────────────────────────────┐
│                  Prometheus 监控服务标准流程                      │
├─────────────────────────────────────────────────────────────────┤
│                                                                  │
│  步骤1:被监控端需要暴露metrics指标                               │
│         ↓                                                        │
│  步骤2:Prometheus Server配置要监控的目标(服务发现)             │
│         ↓                                                        │
│  步骤3:热加载配置文件(无需重启)                                 │
│         ↓                                                        │
│  步骤4:检查Prometheus WebUI验证配置是否生效                      │
│         ↓                                                        │
│  步骤5:Grafana导入Dashboard模板ID                                │
│         ↓                                                        │
│  步骤6:Grafana Dashboard出图展示                                 │
│         ↓                                                        │
│  步骤7:配置相应的告警规则(Alertmanager)                        │
│                                                                  │
└─────────────────────────────────────────────────────────────────┘
八、知识总结
|
模块 |
核心要点 |
|
Prometheus架构 |
Server + Exporters + Grafana + Pushgateway + Alertmanager |
|
部署方式 |
二进制部署、一键脚本 |
|
node-exporter |
暴露Linux系统指标(CPU、内存、磁盘、网络) |
|
PromQL数据类型 |
gauge(当前值)、counter(计数器)、histogram(直方图)、summary(预计算) |
|
PromQL常用 |
rate()、increase()、histogram_quantile() |
|
Grafana |
数据源配置、Dashboard导入(ID: 1860/10619/14057等) |
|
cAdvisor |
Docker容器监控 |
|
mysqld_exporter |
MySQL数据库监控 |
|
windows_exporter |
Windows操作系统监控 |
|
监控标准流程 |
暴露指标 → 配置Prometheus → 热加载 → 验证 → Grafana展示 → 告警 |

汇聚全球AI编程工具,助力开发者即刻编程。
更多推荐



 20
20 0
0- 0


 已为社区贡献11条内容

所有评论(0)