
基于 Prometheus 的 Windows 主机监控平台部署实践
目录
Prometheus
下载 Prometheus
确保你的 Windows 系统满足 Prometheus 的运行要求(推荐 Windows 10 或更高版本)。
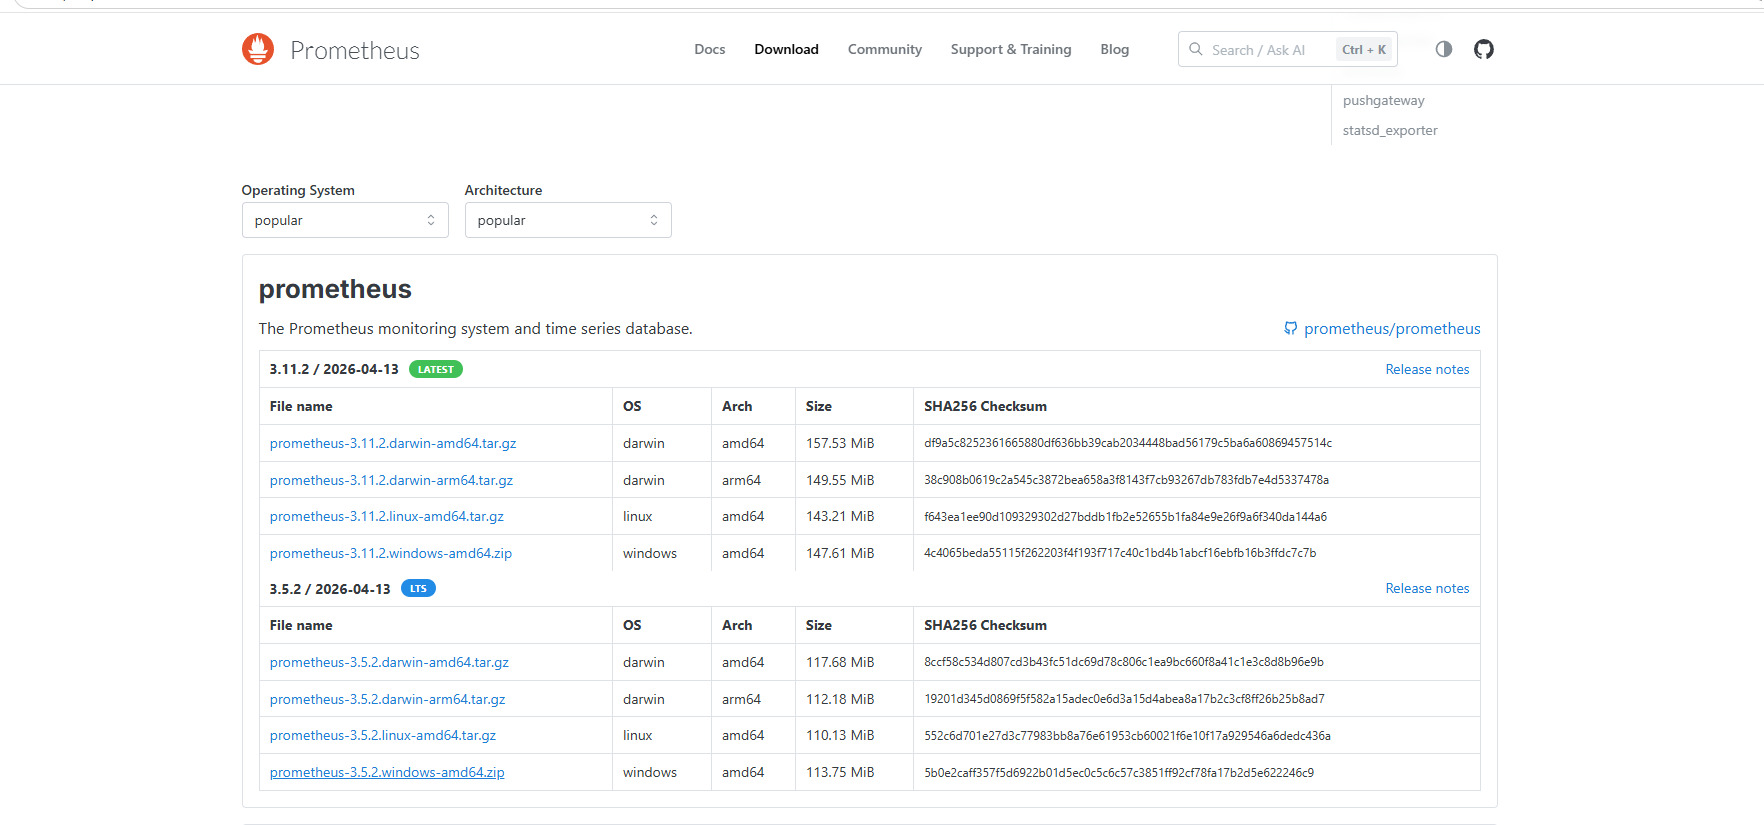
打开 Prometheus 官方下载页面,找到适用于 Windows 的最新版本。
下载 prometheus-<版本号>.windows-amd64.zip 文件,例如 prometheus-2.45.4.windows-amd64.zip。
解压安装包
在 D:\ 盘根目录下创建一个名为 prometheus 的文件夹,路径为 D:\prometheus。
将下载的 prometheus-<版本号>.windows-amd64.zip 文件解压到 D:\prometheus 文件夹中。
配置 Prometheus
打开 D:\prometheus\prometheus.yml 文件,根据需要修改配置内容。以下是一个简单的示例配置:
global:
  scrape_interval: 15s  # 数据抓取间隔
  evaluation_interval: 15s  # 规则评估间隔

scrape_configs:
  - job_name: 'prometheus'  # 监控 Prometheus 自身
    static_configs:
      - targets: ['localhost:9090']
启动 Prometheus
打开 PowerShell,切换到 D:\prometheus
cd D:\prometheus

运行 prometheus.exe

.\prometheus.exe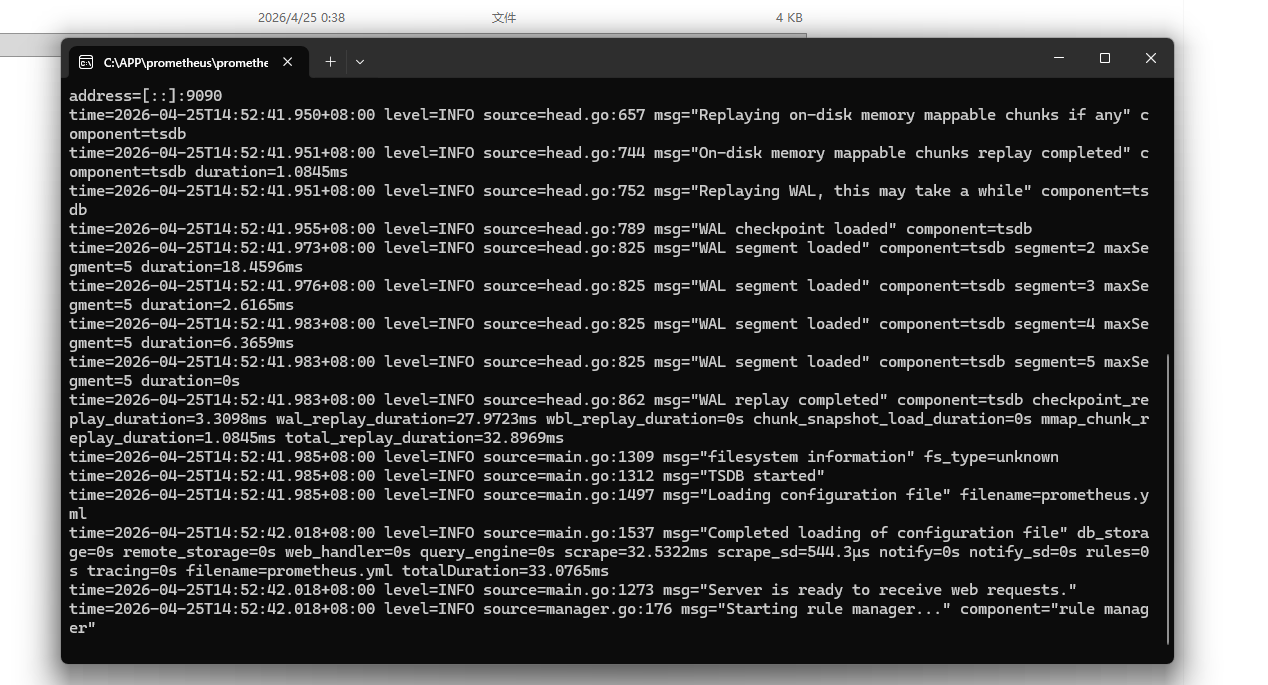
访问 Prometheus Web 界面
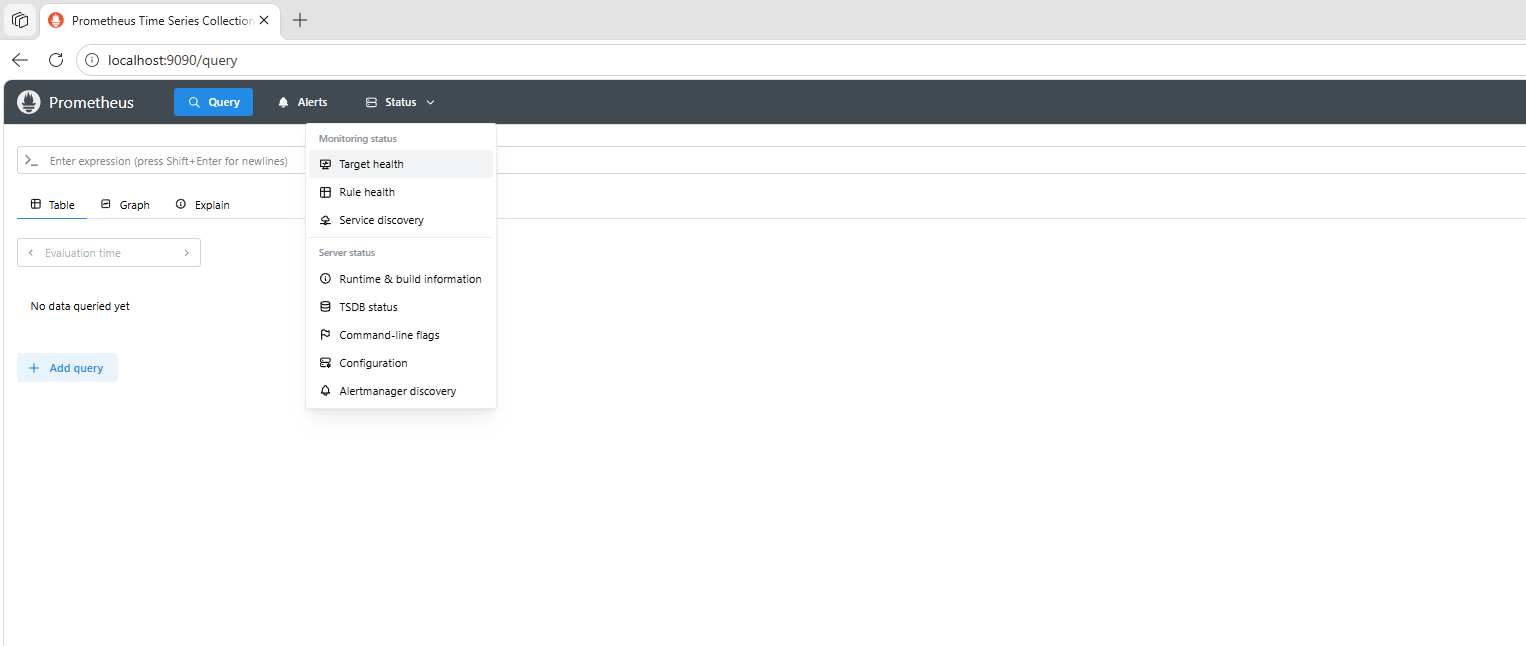
在浏览器地址栏输入 http://localhost:9090,访问 Prometheus 的 Web 界面。
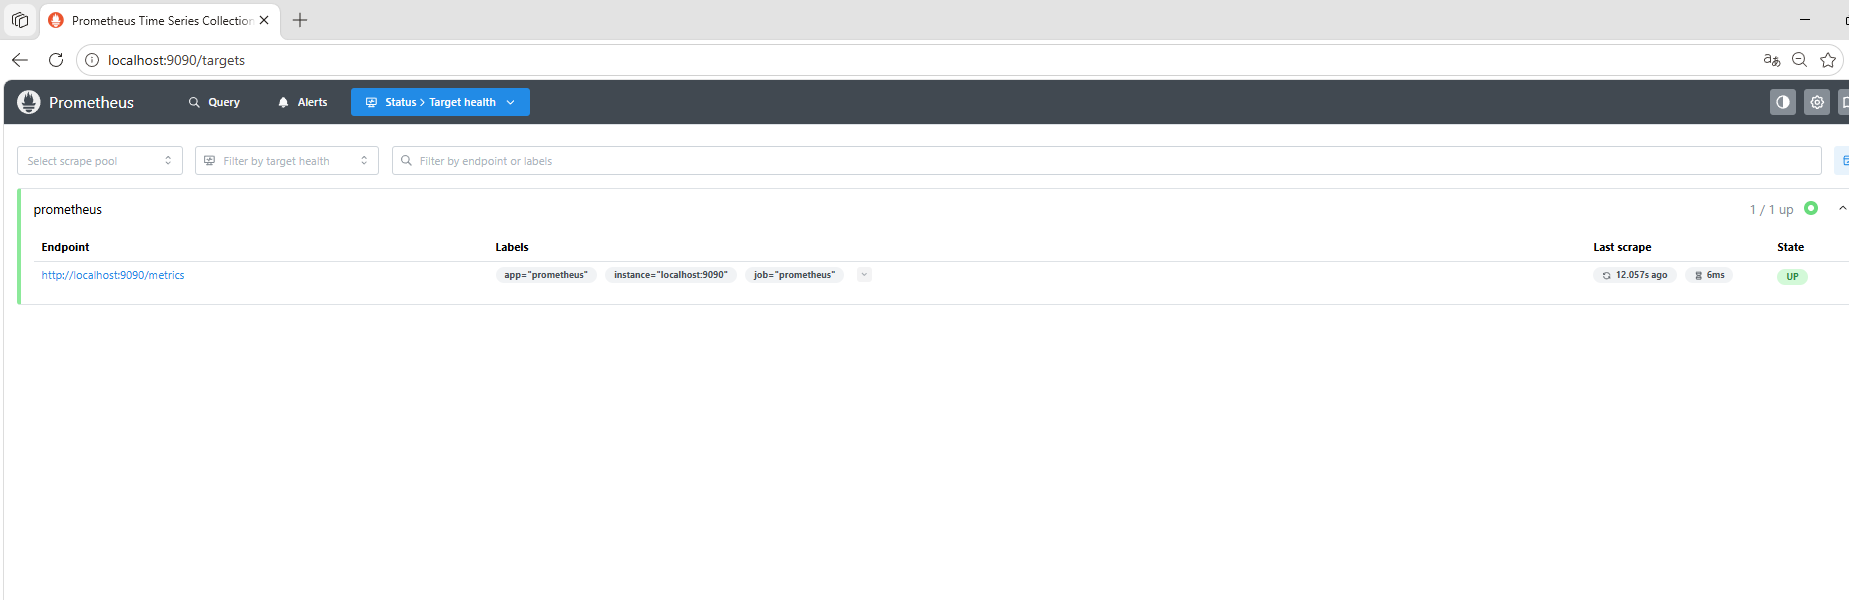
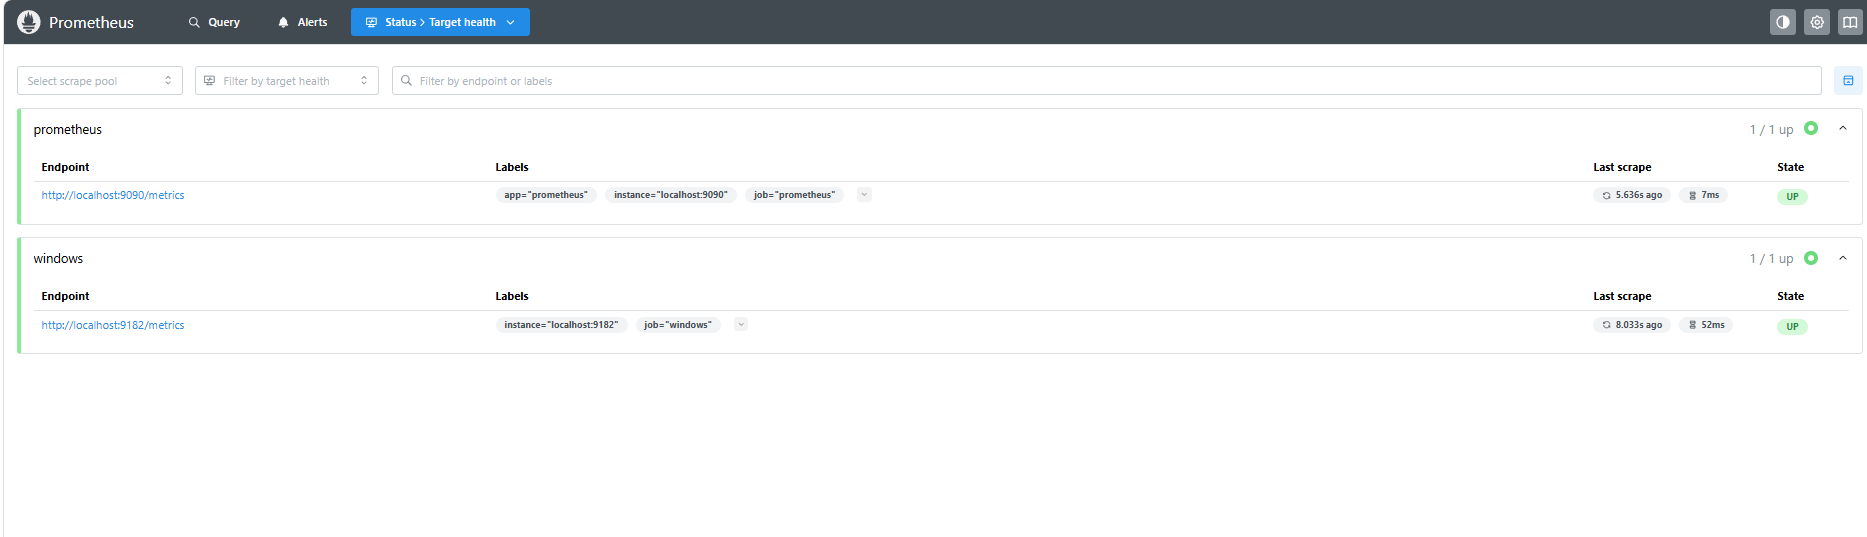
在 Prometheus 界面中,点击左侧菜单栏的 Status -> Targets,查看已配置的监控目标是否正常抓取数据。
Windows Exporter
要在 Windows 主机上采集系统信息给 Prometheus,核心是使用 Windows Exporter(原叫 wmi_exporter),下面给你一套完整可直接照着做的步骤
下载 Windows Exporter
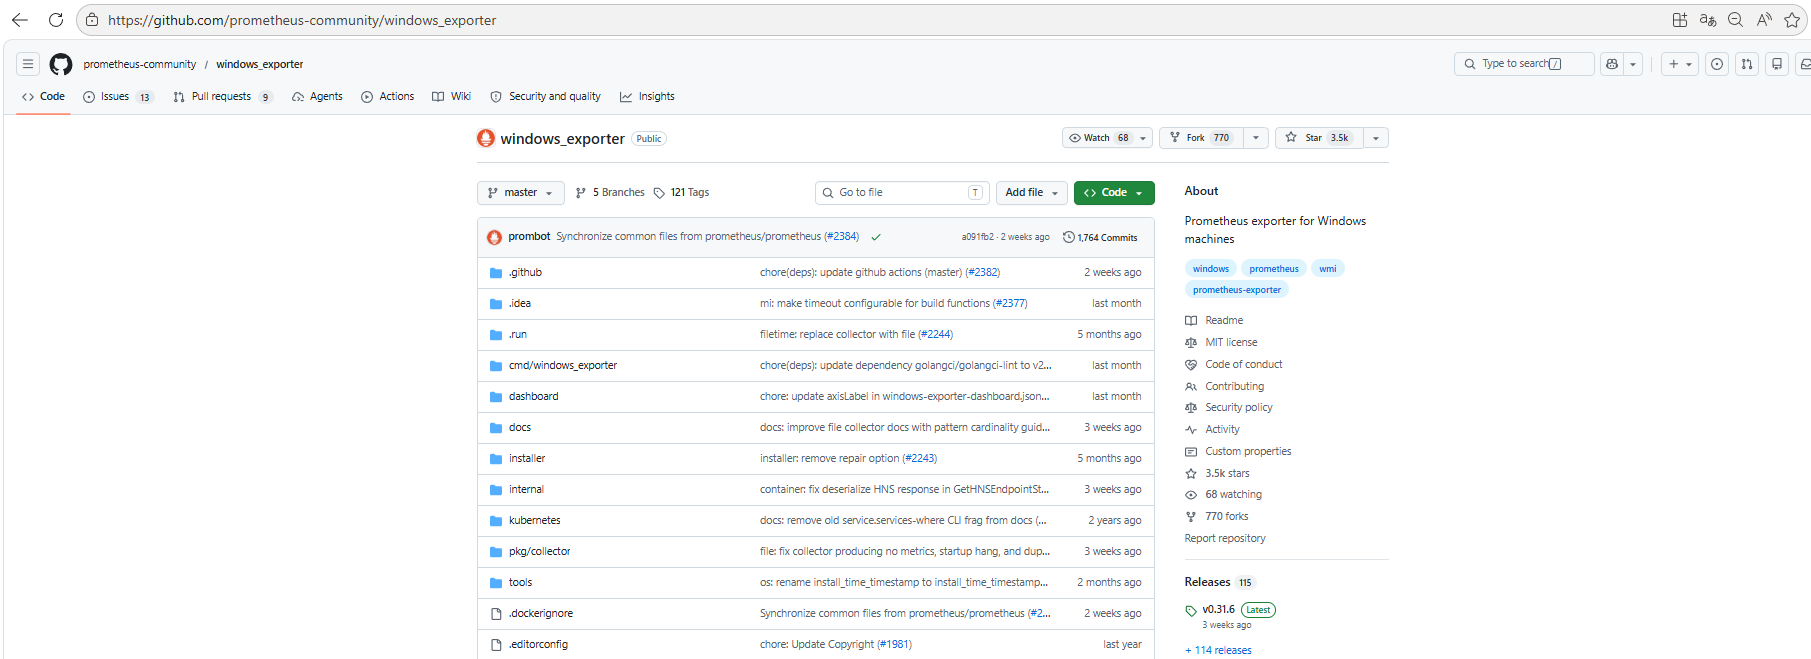
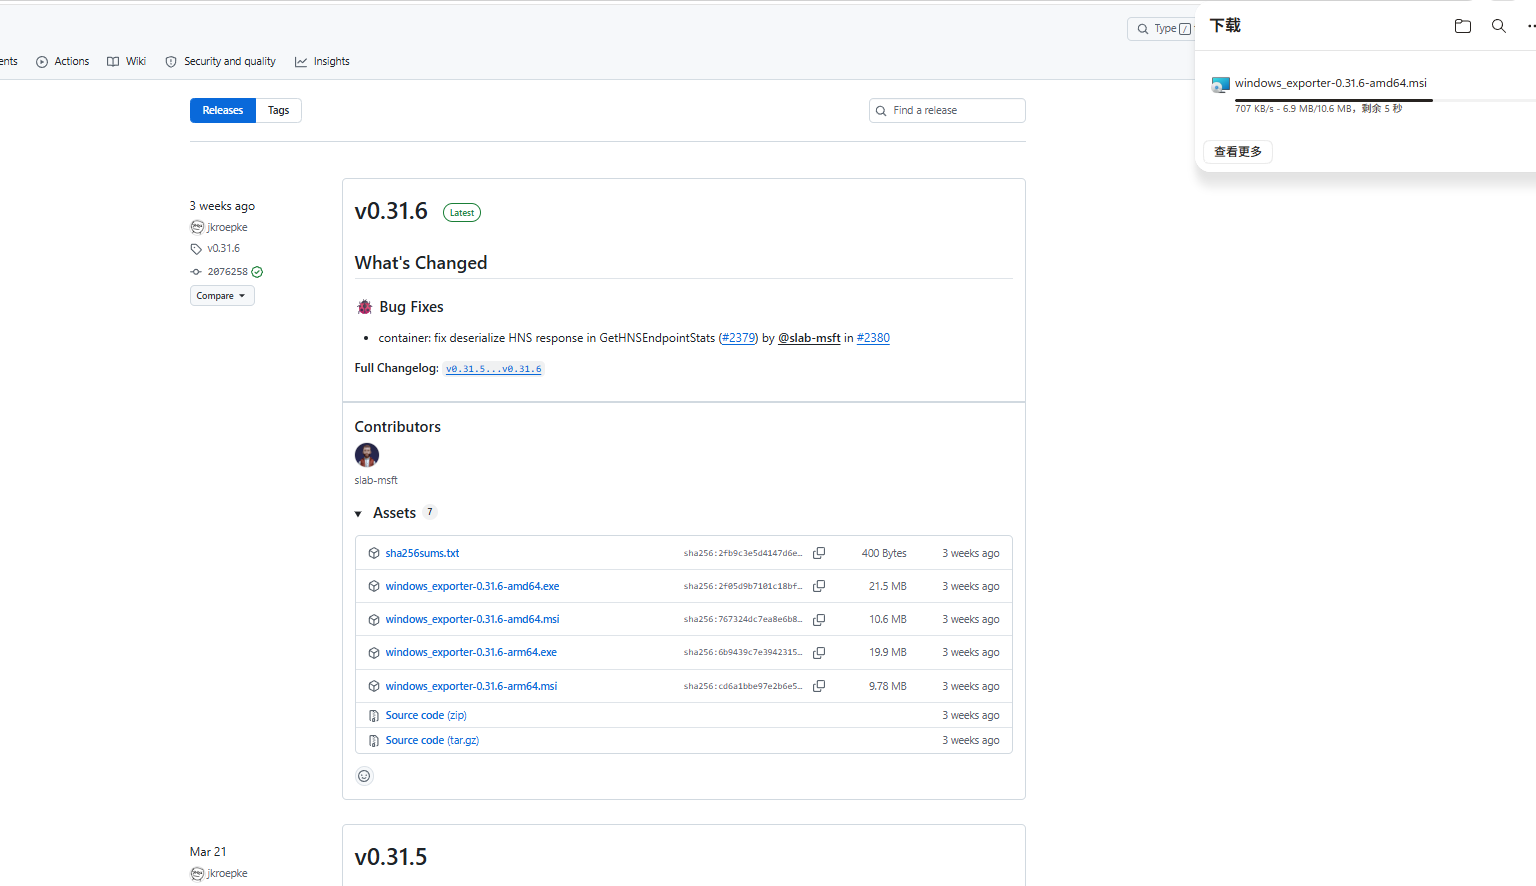
前往官方下载页:https://github.com/prometheus-community/windows_exporter/releases
下载最新版的 windows_exporter-*.amd64.msi(64 位 Windows)
安装并配置
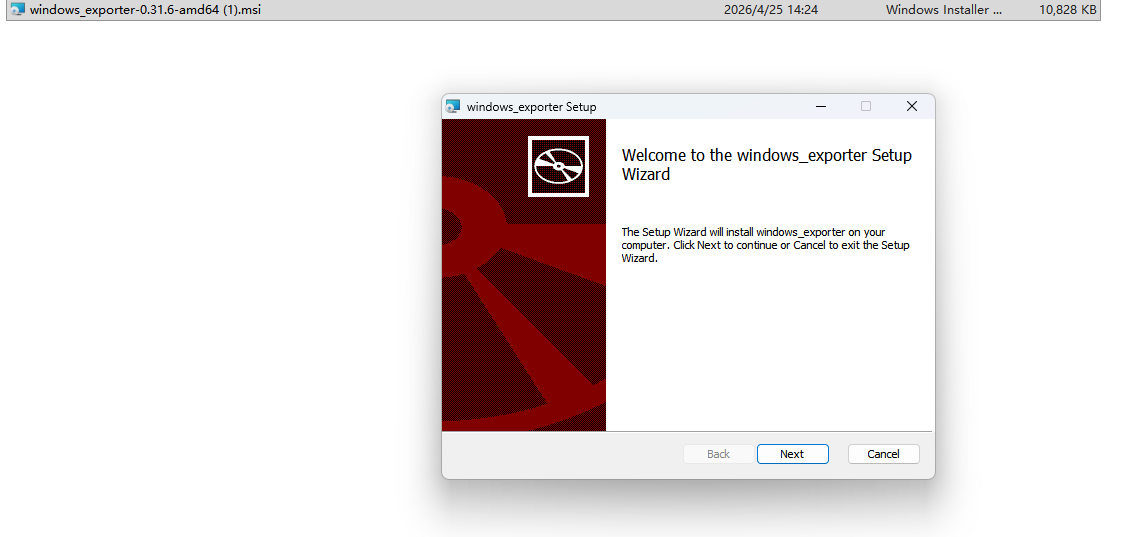
双击 .msi 安装包,一路默认下一步即可
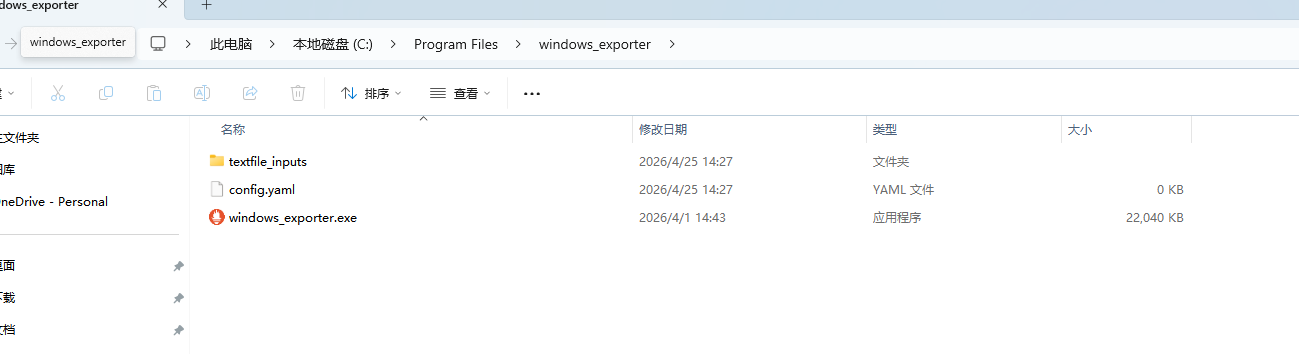
默认安装路径:C:\Program Files\windows_exporter
默认监听端口:9182
安装完成后,Windows 会自动创建一个名为 windows_exporter 的服务,并开机自启。
验证采集是否正常
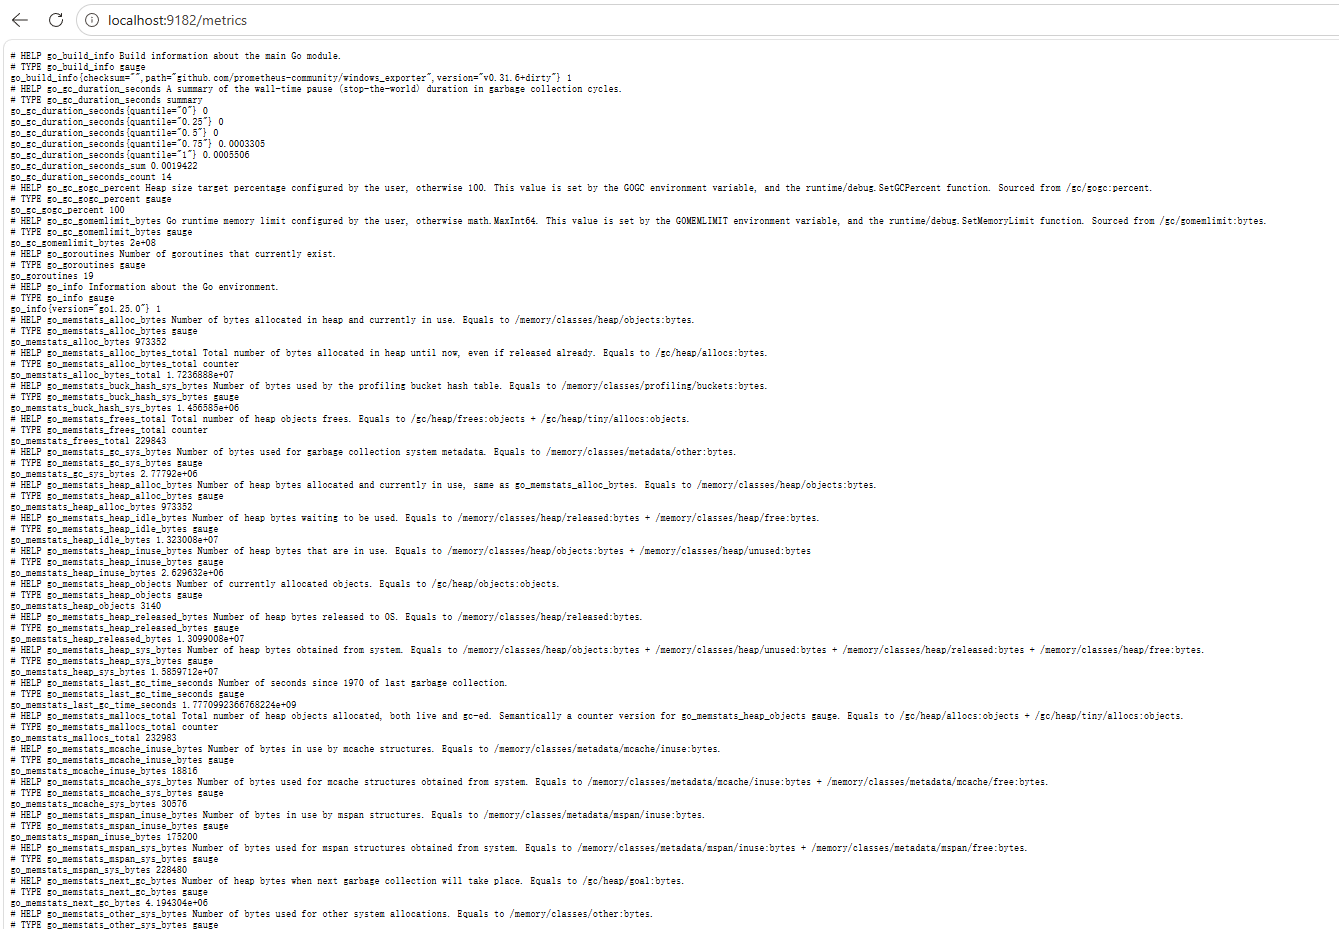
在这台 Windows 主机上打开浏览器,访问:
http://localhost:9182/metrics如果能看到大量 Prometheus 格式的指标文本,说明采集正常。
把 Exporter 加入 Prometheus 监控
还差最后一步配置,否则 Prometheus 收不到 Windows 系统指标。
打开 D:\prometheus\prometheus.yml,追加一段配置:
global:
  scrape_interval: 15s
  evaluation_interval: 15s

scrape_configs:
  - job_name: 'prometheus'
    static_configs:
      - targets: ["localhost:9090"]

  # 新增这一段,监控 Windows 系统指标
  - job_name: 'windows'
    static_configs:
      - targets: ["localhost:9182"]  # Exporter 地址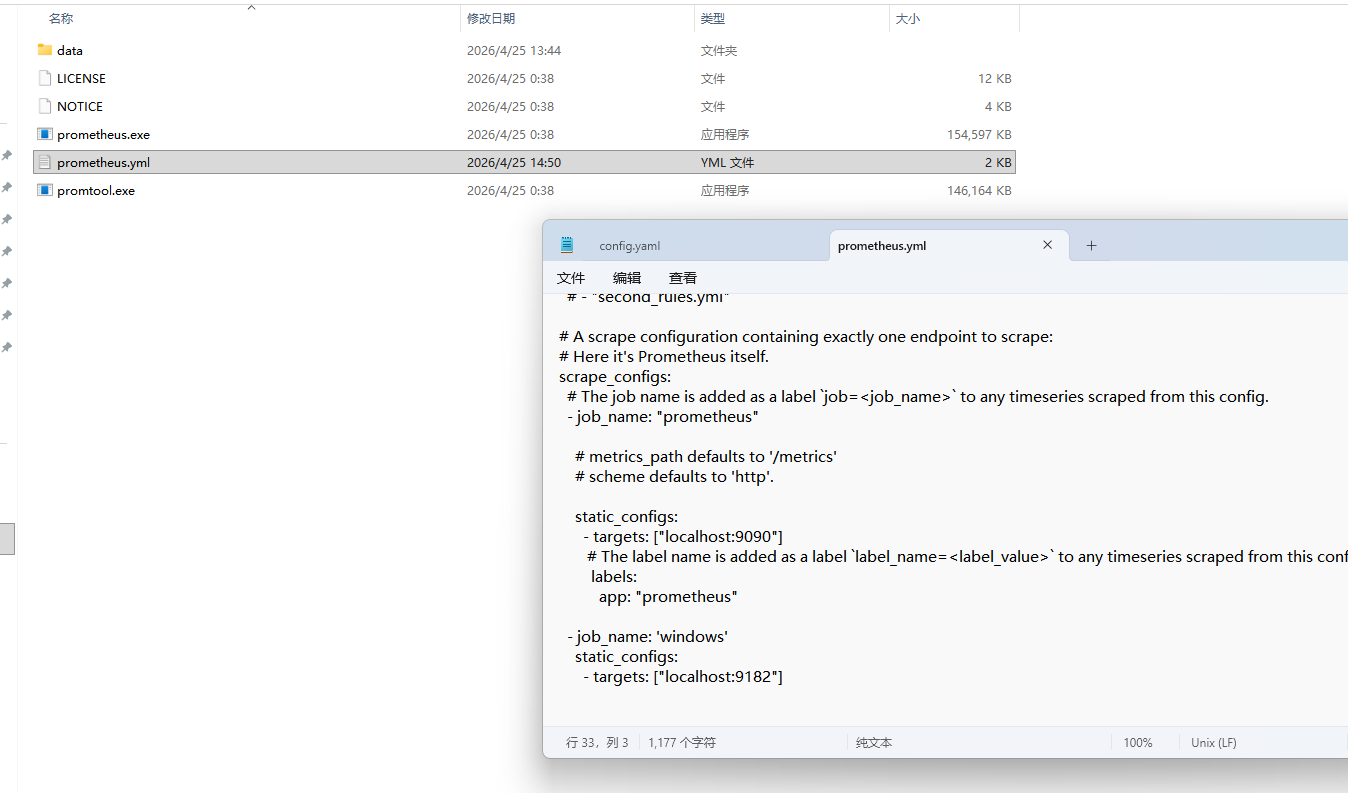
重启 Prometheus 生效
关闭正在运行的 Prometheus(Ctrl + C),重新执行:
cd D:\prometheus
.\prometheus.exe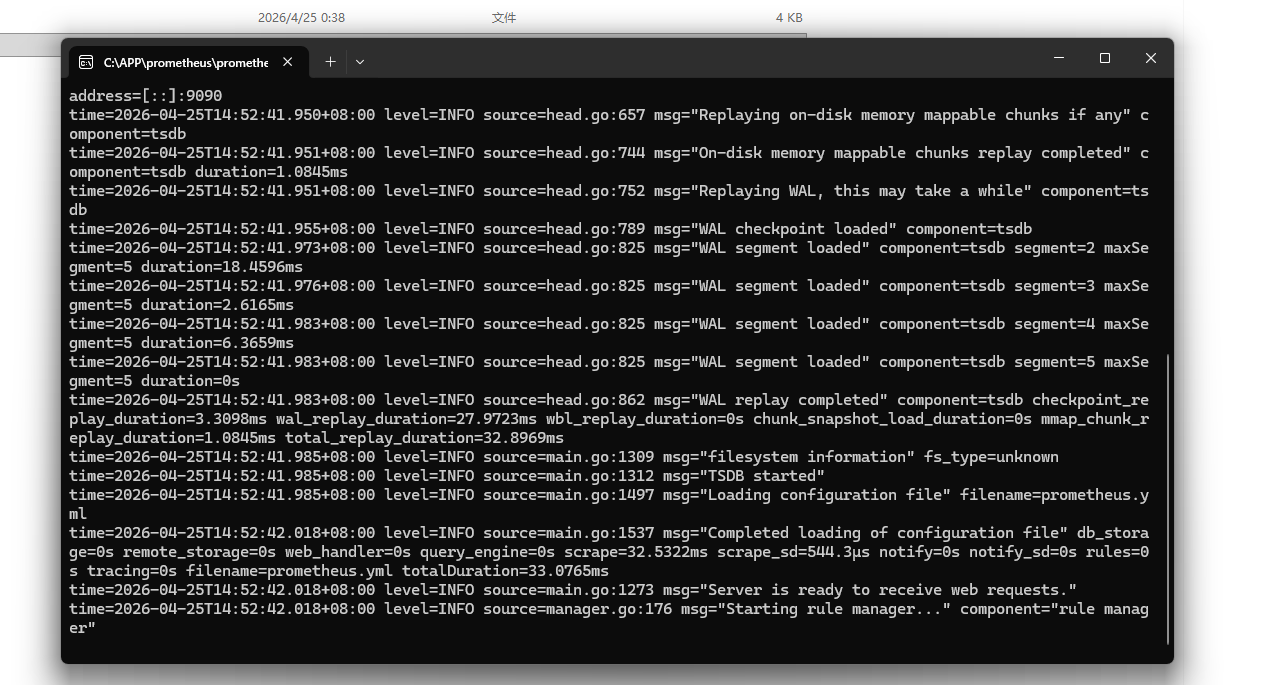
验证 打开 http://localhost:9090/targets
Grafana
下载 Grafana
访问 Grafana 官方下载页面:https://grafana.com/grafana/download。
选择适合 Windows 的版本:
推荐使用 .msi 安装程序:适合大多数用户,安装简单。
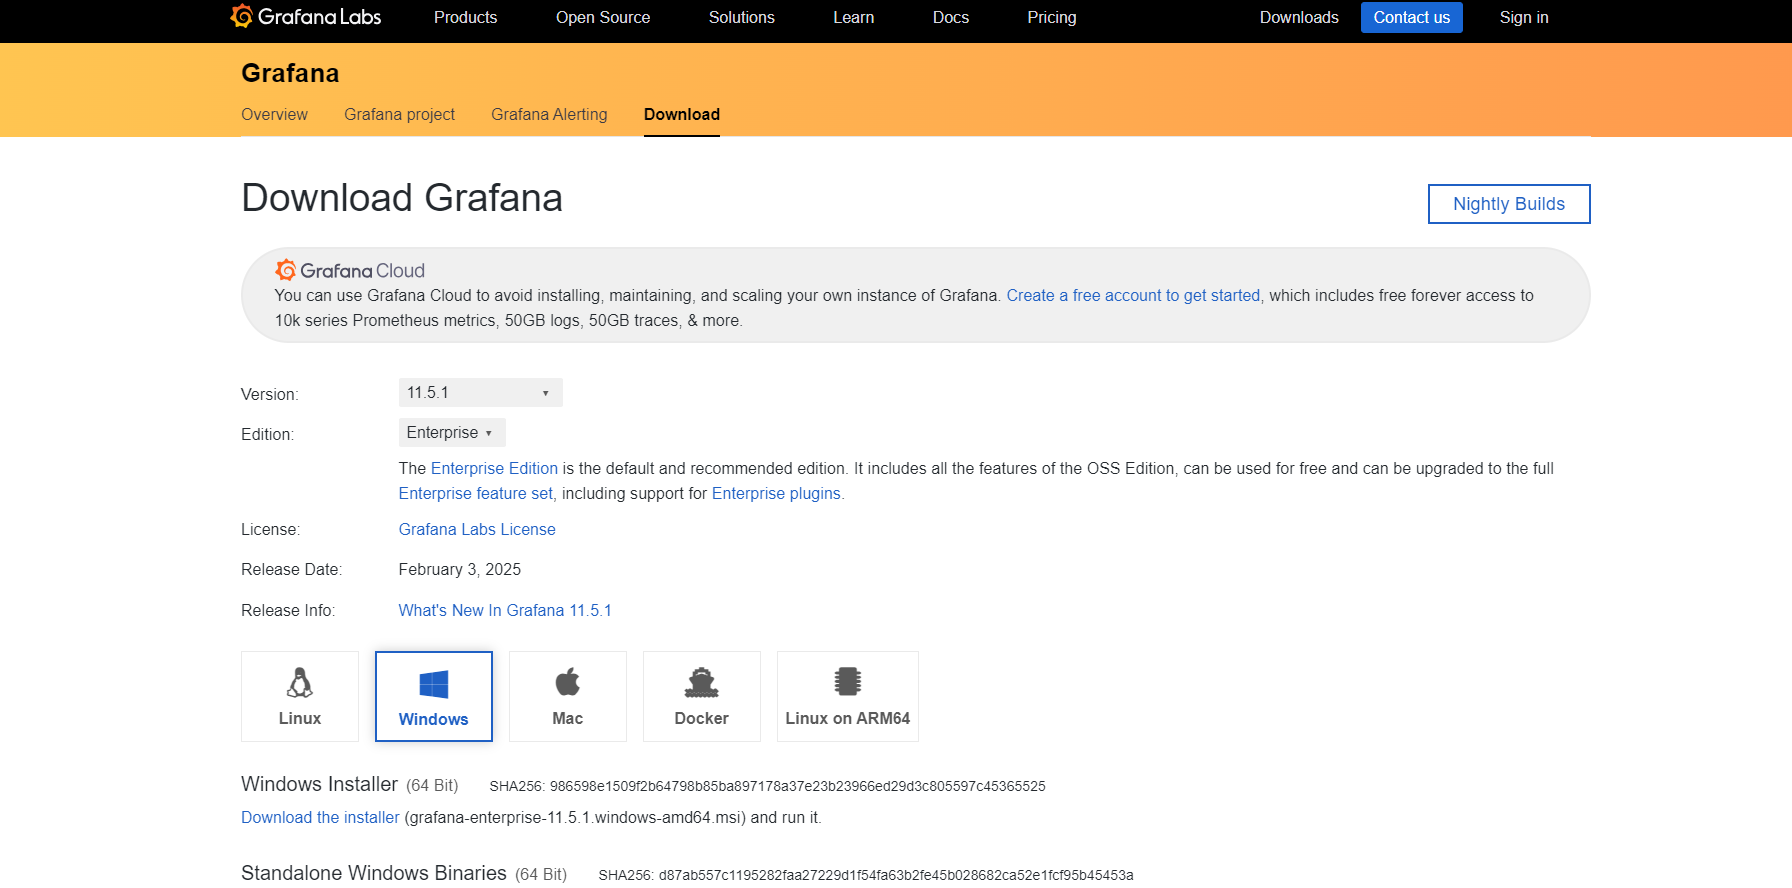
安装 Grafana
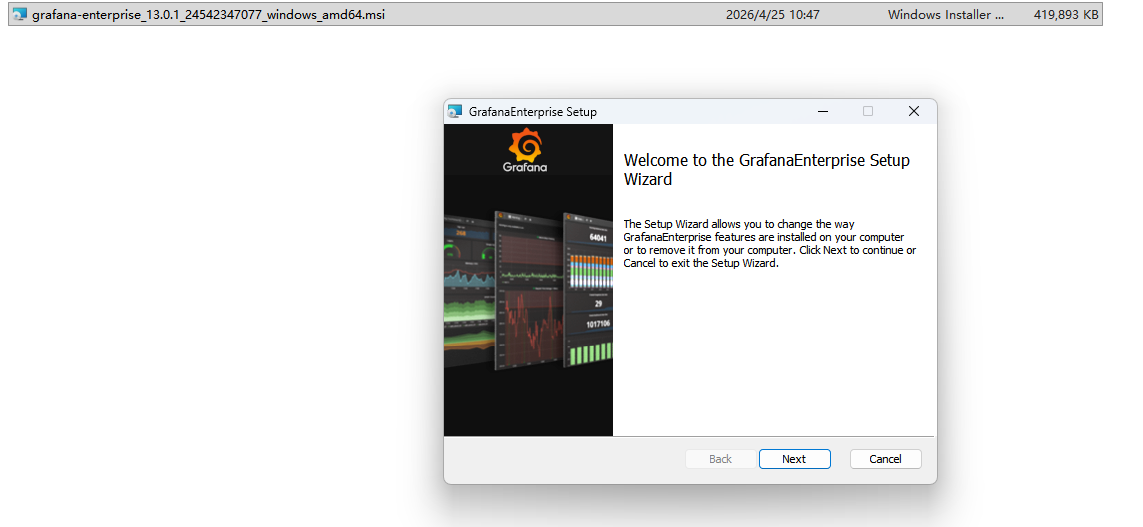
使用 .msi 安装程序
双击下载的 .msi 文件,启动安装向导。
点击 “Next”,接受许可协议。
选择安装路径(自定义)。
点击 “Install”,等待安装完成。
安装完成后,点击 “Finish”。
启动 Grafana
打开命令提示符(CMD),进入 Grafana 的 bin 文件夹
cd C:\Program Files\GrafanaLabs\grafana\bin 运行以下命令启动 Grafana:
grafana-server.exe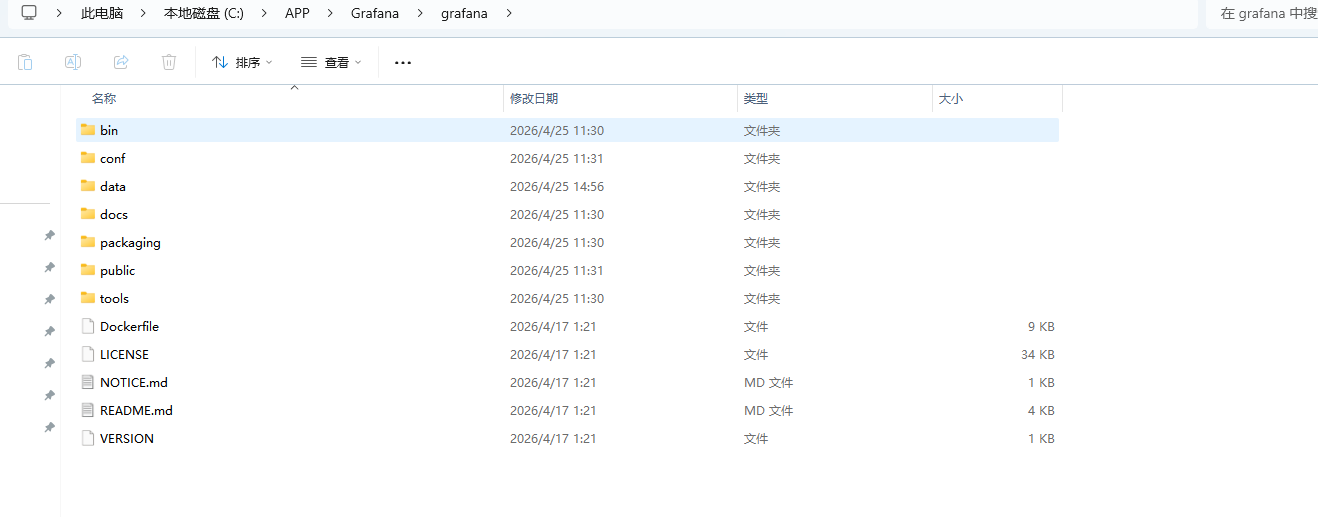
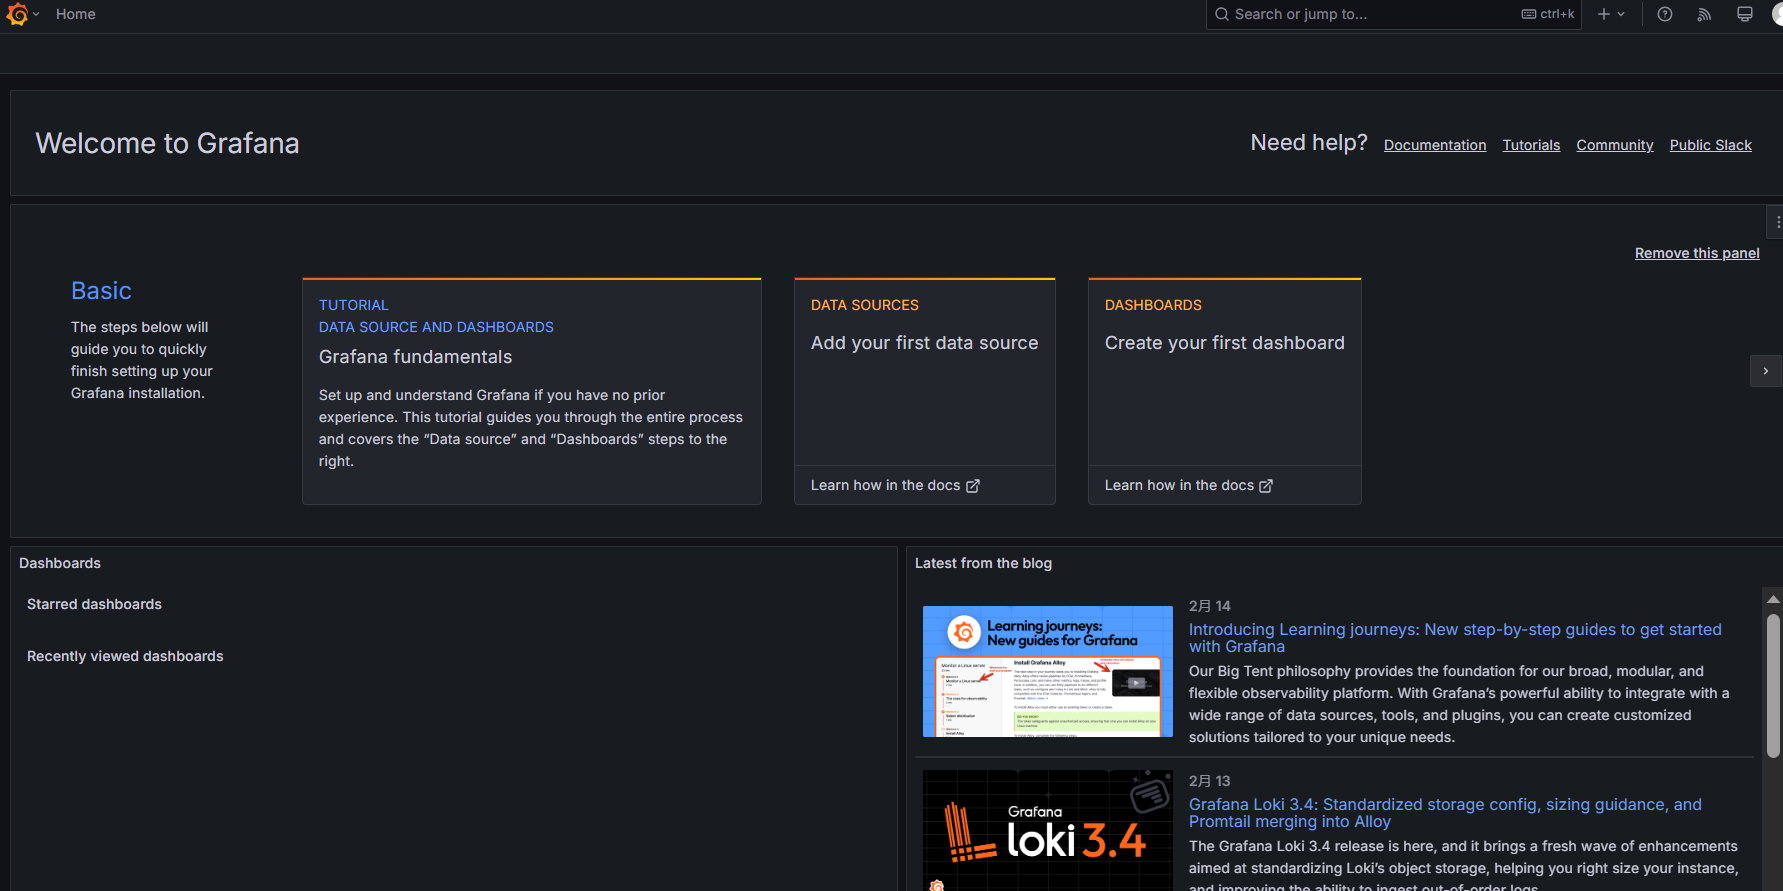
访问 Grafana
打开浏览器,http://localhost:3000/。
使用默认用户名和密码登录:
- 用户名:
admin - 密码:
admin
首次登录后,建议立即修改密码。
配置 Grafana(可选)
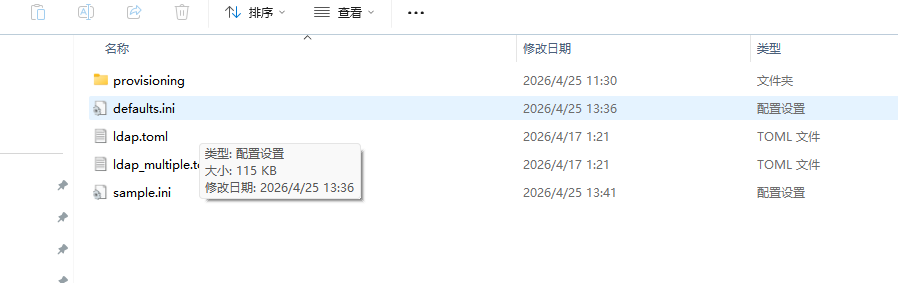
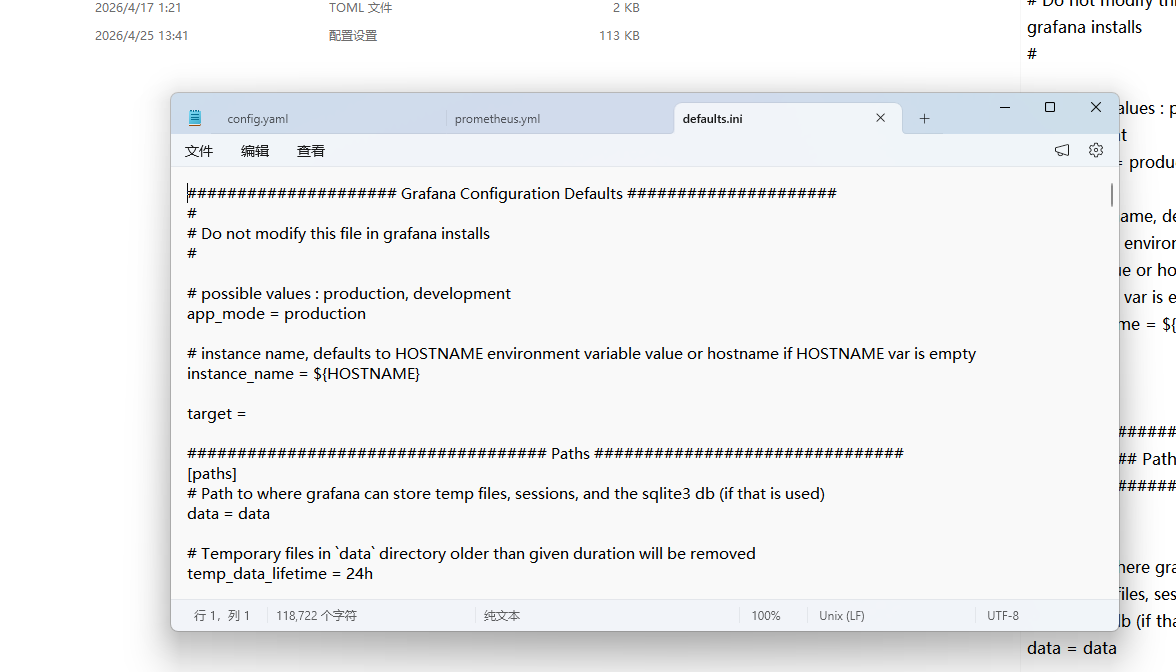
修改默认端口: conf\ defaults.ini 文件,取消注释以下行并修改端口号:
[server]
http_port = 8080

汉化
default_language = zh-Hans
保存文件后重启 Grafana 服务。
其他配置:可以在 conf\ defaults.ini 文件中根据需求进行更多配置,如数据源、日志级别等。
配置数据源
打开 Grafana 的 Web 界面,登录到你的 Grafana 实例。
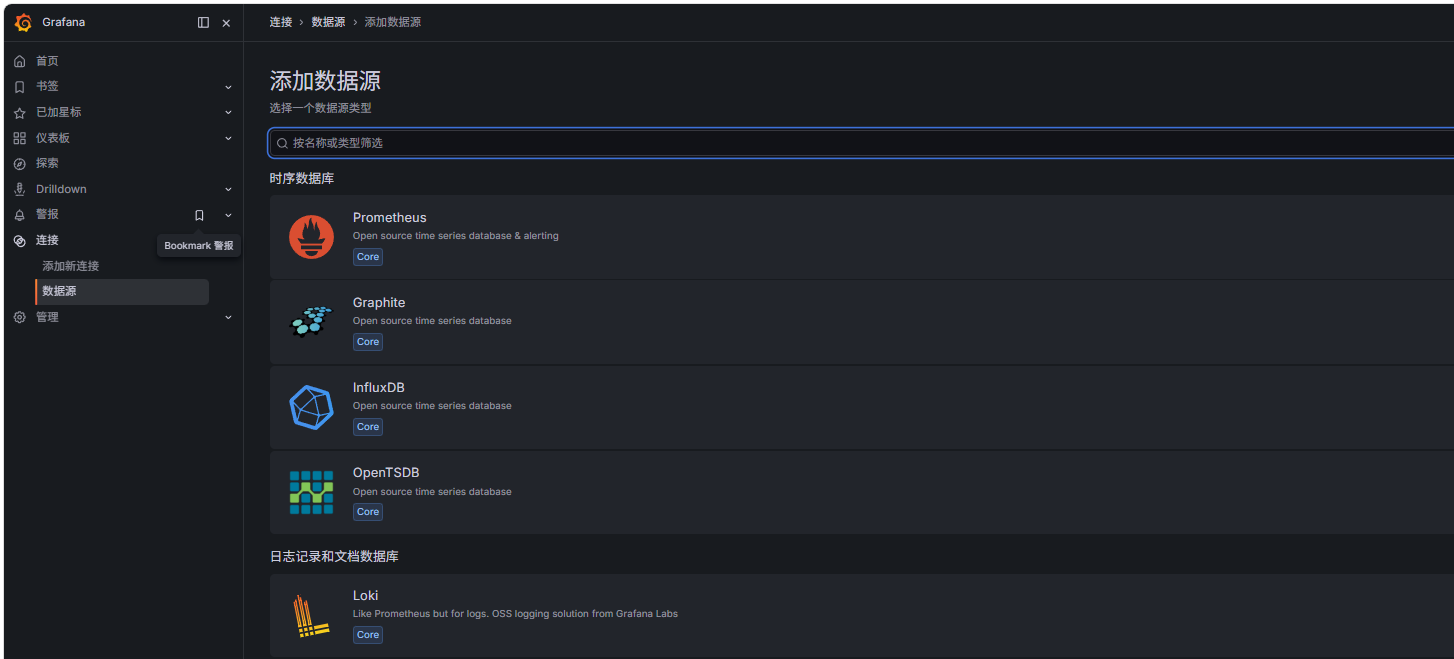
在左侧菜单栏中,点击 “连接”,然后选择 “数据源”,比如:选择 Prometheus 作为数据源类型。
点击 “添加数据源” 按钮,在弹出的列表中选择 “Prometheus”。
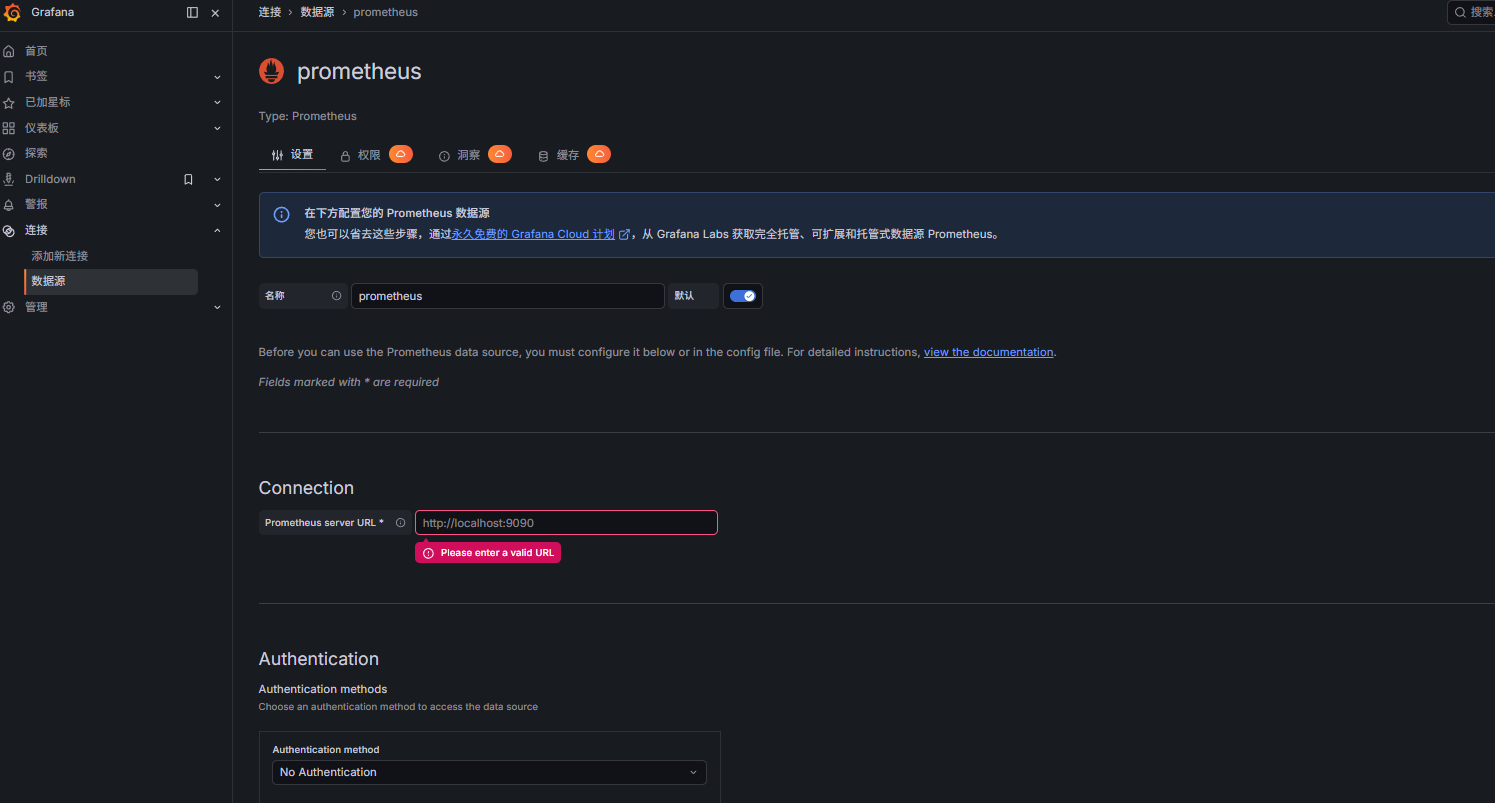
在 “URL” 字段中输入 Prometheus 的地址,例如:http://localhost:9090。
如果连接失败,可能是以下原因之一:
- 网络问题:确保 Grafana 和 Prometheus 之间的网络是连通的。
- Prometheus 服务未启动:检查 Prometheus 是否正在运行。
- 地址错误:检查 Prometheus 的地址是否正确,包括 IP 和端口。
- 防火墙限制:确保没有防火墙阻止 Grafana 访问 Prometheus。
保存并测试连接
点击 “Save & Test” 按钮,Grafana 会尝试连接到 Prometheus 并验证配置是否成功。

导入仪表盘
查找仪表盘模板
Grafana 提供了丰富的仪表盘模板,可以帮助你快速搭建监控视图。
访问 Grafana 官方仪表盘库。
在搜索栏中输入关键词,例如 “CPU”、“内存”、“磁盘” 或 “网络”,找到适合你需求的仪表盘模板。
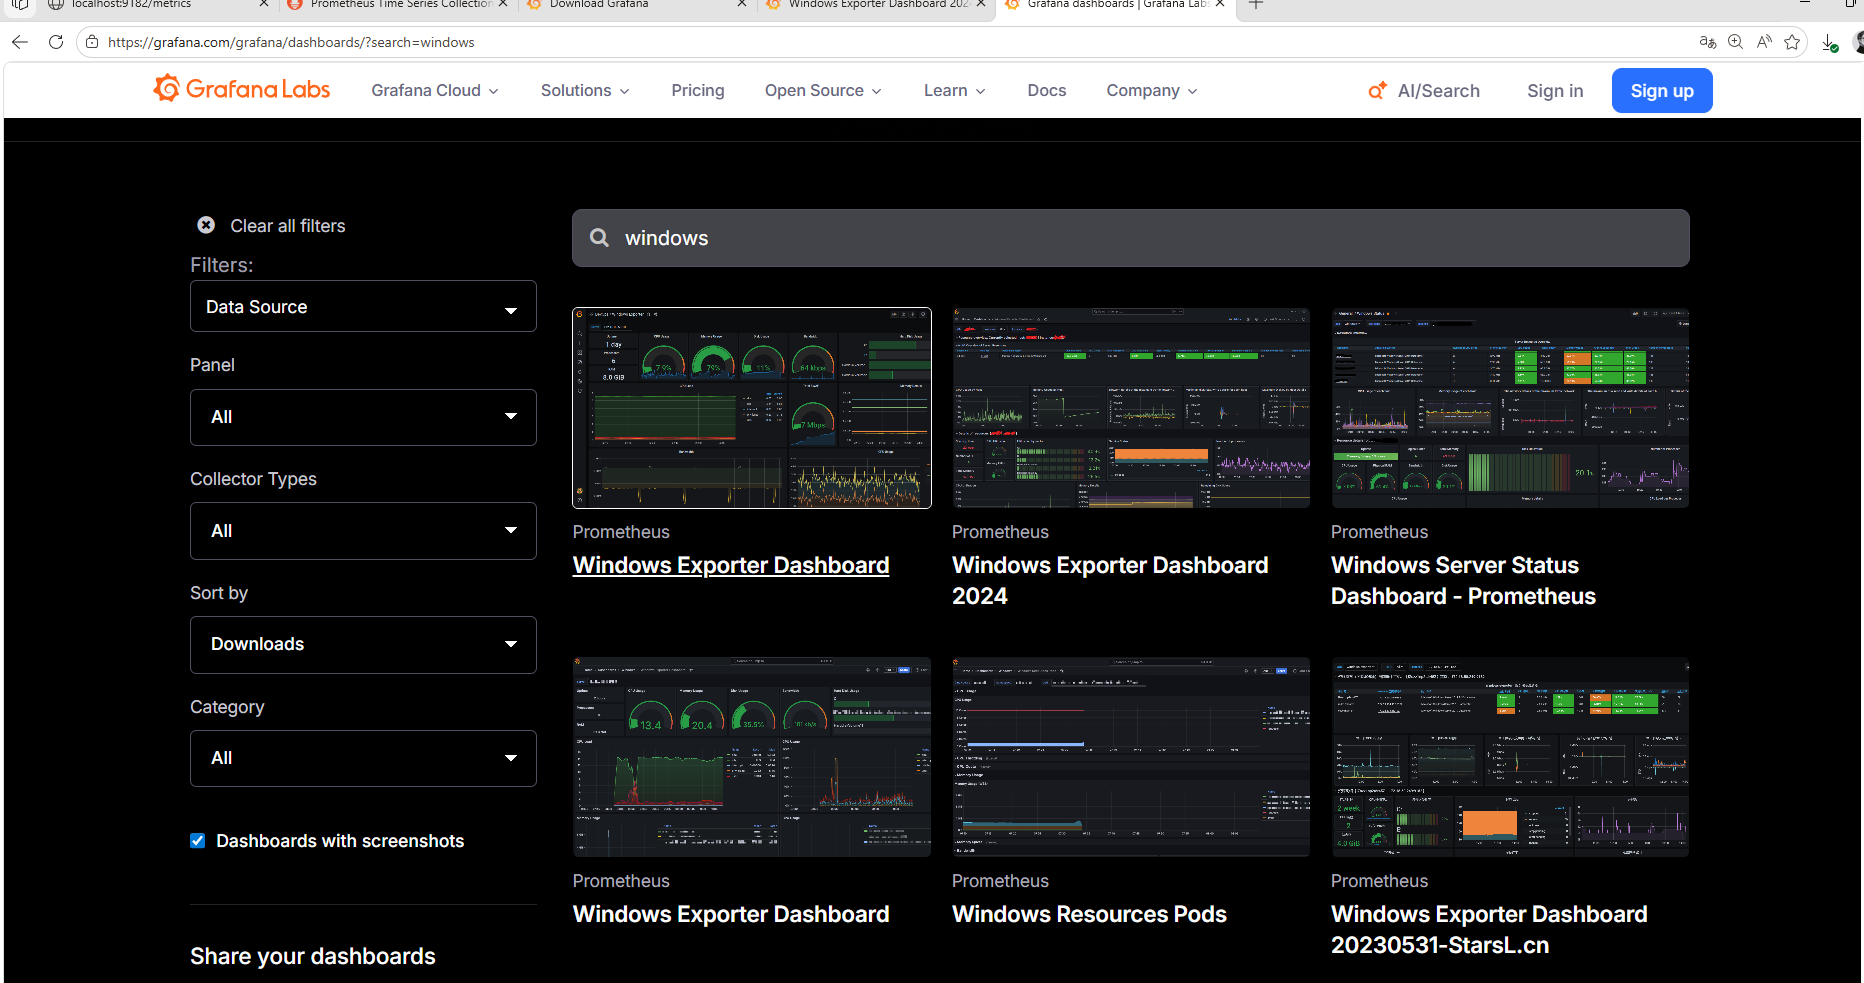
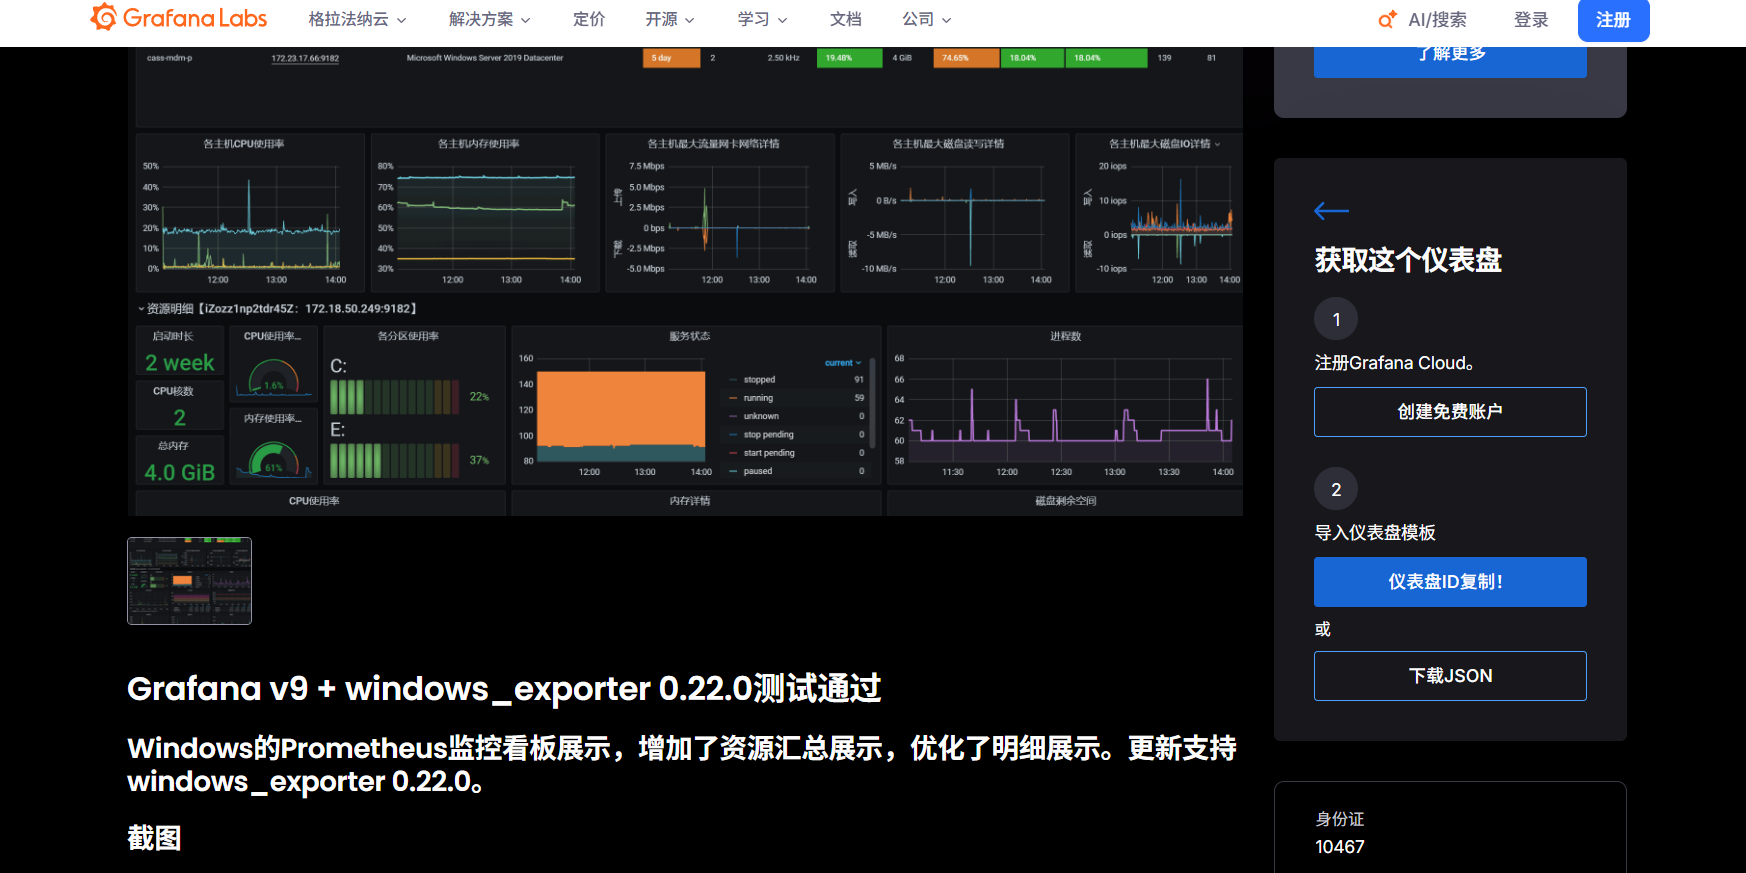
找到后复制仪表盘ID
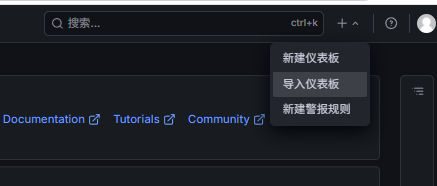
导入仪表盘
在左侧菜单栏中选择 "+",然后选择 "导入仪表盘"。
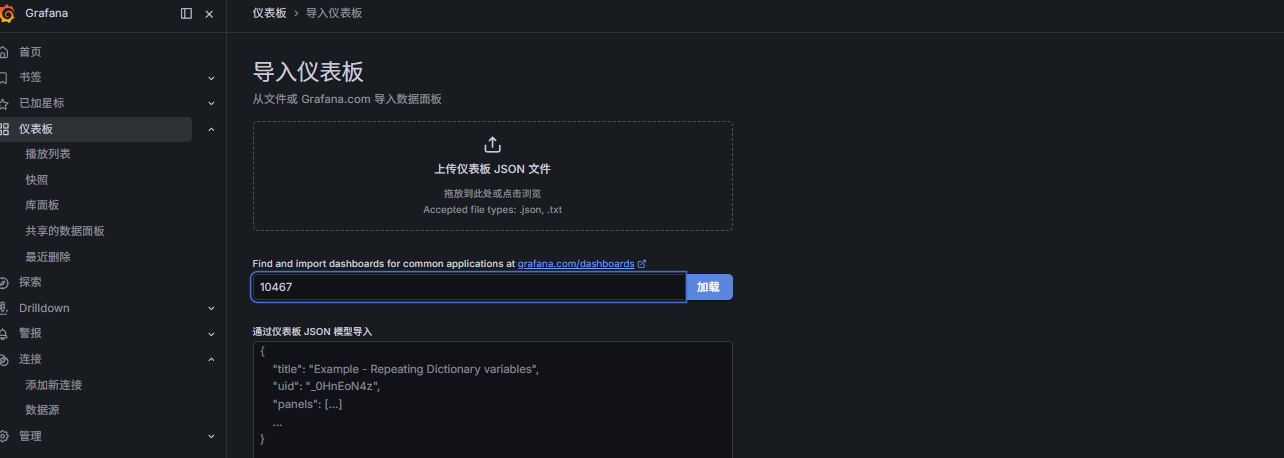
复制仪表盘ID,点加载。
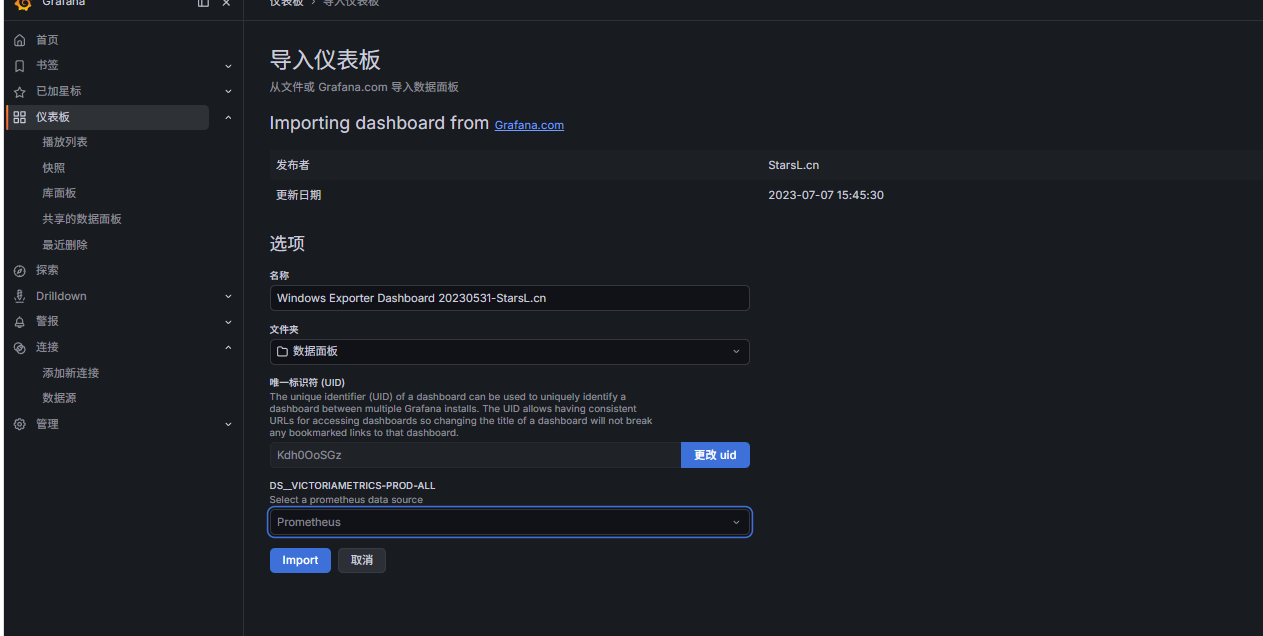
配置数据源面板加载后,会让你选择数据源,在 Prometheus 下拉框里,选择你配置好的 Prometheus 数据源。
完成导入其他选项保持默认,直接点击页面底部的 Import,等待几秒,面板就导入成功了。
删除模板
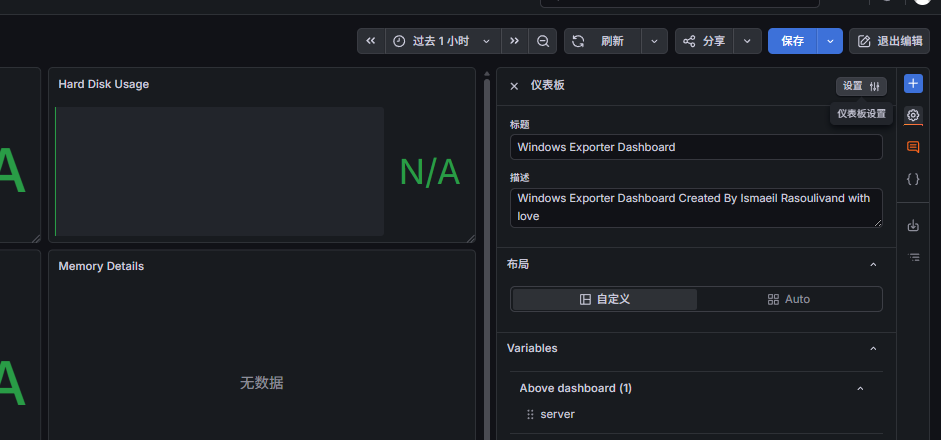
找到仪表盘设置看页面右上角,在 “编辑” 按钮的左边,有个齿轮形状的设置图标,点击它进入仪表盘设置页。
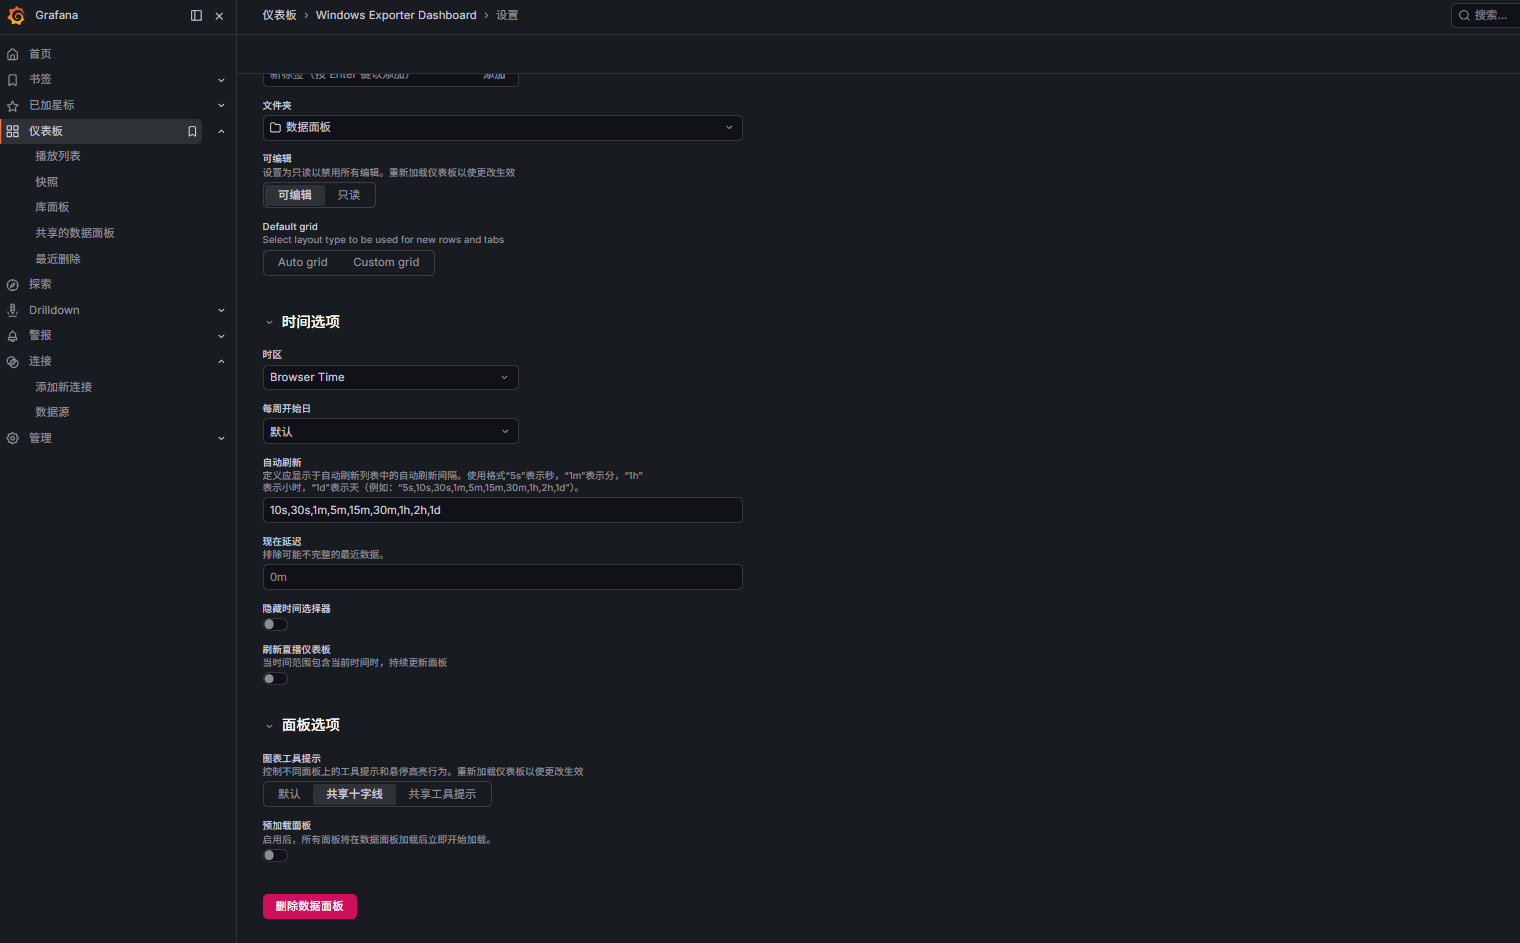
执行删除操作拉到设置页面的最底部,找到红色的 Delete dashboard 按钮,点击它。
确认删除在弹出的确认窗口里,再次点击 Delete,这个仪表盘就被永久删除了。
自定义模板
{
  "annotations": {
    "list": [
      {
        "builtIn": 1,
        "datasource": {
          "type": "grafana",
          "uid": "-- Grafana --"
        },
        "enable": true,
        "hide": true,
        "iconColor": "rgba(0, 211, 255, 1)",
        "name": "Annotations & Alerts",
        "type": "dashboard"
      }
    ]
  },
  "editable": true,
  "gnetId": null,
  "graphTooltip": 1,
  "id": null,
  "iteration": 1718000000000,
  "links": [],
  "panels": [
    {
      "collapsed": false,
      "datasource": null,
      "gridPos": {
        "h": 3,
        "w": 24,
        "x": 0,
        "y": 0
      },
      "id": 200,
      "panels": [],
      "title": "🖥️ Windows 主机总览 | 高性能炫酷监控",
      "type": "row"
    },
    {
      "cards": {
        "cardBorder": "dark",
        "cardMargin": 15,
        "hideHeader": true
      },
      "collapsed": false,
      "colorMode": "value",
      "datasource": "prometheus",
      "fontSize": "110%",
      "gridPos": {
        "h": 4,
        "w": 6,
        "x": 0,
        "y": 3
      },
      "id": 101,
      "maxPerRow": 1,
      "options": {
        "colorMode": "value",
        "graphMode": "none",
        "justifyMode": "auto",
        "orientation": "vertical",
        "reduceOptions": {
          "calcs": ["lastNotNull"],
          "fields": "",
          "values": false
        },
        "textMode": "auto"
      },
      "targets": [
        {
          "expr": "100 - avg(irate(windows_cpu_time_total{instance=\"localhost:9182\",mode=\"idle\"}[1m])) * 100",
          "legendFormat": "CPU 使用率",
          "refId": "A"
        }
      ],
      "title": "⚙️ CPU 占用",
      "type": "stat",
      "unit": "percent"
    },
    {
      "datasource": "prometheus",
      "gridPos": {
        "h": 4,
        "w": 6,
        "x": 6,
        "y": 3
      },
      "id": 102,
      "options": {
        "colorMode": "value",
        "graphMode": "none",
        "justifyMode": "auto",
        "orientation": "vertical",
        "reduceOptions": {
          "calcs": ["lastNotNull"],
          "fields": "",
          "values": false
        },
        "textMode": "auto"
      },
      "targets": [
        {
          "expr": "100 - (windows_physical_memory_available_bytes{instance=\"localhost:9182\"} / windows_physical_memory_total_bytes{instance=\"localhost:9182\"} * 100)",
          "legendFormat": "内存使用率",
          "refId": "A"
        }
      ],
      "title": "🧠 内存占用",
      "type": "stat",
      "unit": "percent"
    },
    {
      "datasource": "prometheus",
      "gridPos": {
        "h": 4,
        "w": 6,
        "x": 12,
        "y": 3
      },
      "id": 103,
      "options": {
        "colorMode": "value",
        "graphMode": "none",
        "justifyMode": "auto",
        "orientation": "vertical",
        "reduceOptions": {
          "calcs": ["lastNotNull"],
          "fields": "",
          "values": false
        },
        "textMode": "auto"
      },
      "targets": [
        {
          "expr": "100 - (windows_logical_disk_free_bytes{instance=\"localhost:9182\",volume=\"C:\"} / windows_logical_disk_size_bytes{instance=\"localhost:9182\",volume=\"C:\"} * 100)",
          "legendFormat": "C盘使用率",
          "refId": "A"
        }
      ],
      "title": "💾 C盘占用",
      "type": "stat",
      "unit": "percent"
    },
    {
      "datasource": "prometheus",
      "gridPos": {
        "h": 4,
        "w": 6,
        "x": 18,
        "y": 3
      },
      "id": 104,
      "options": {
        "colorMode": "value",
        "graphMode": "none",
        "justifyMode": "auto",
        "orientation": "vertical",
        "reduceOptions": {
          "calcs": ["lastNotNull"],
          "fields": "",
          "values": false
        },
        "textMode": "auto"
      },
      "targets": [
        {
          "expr": "windows_system_processes{instance=\"localhost:9182\"}",
          "legendFormat": "进程总数",
          "refId": "A"
        }
      ],
      "title": "📋 进程数量",
      "type": "stat"
    },
    {
      "collapsed": false,
      "gridPos": {
        "h": 1,
        "w": 24,
        "x": 0,
        "y": 7
      },
      "id": 300,
      "panels": [],
      "title": "📈 详细性能曲线",
      "type": "row"
    },
    {
      "aliasColors": {},
      "bars": false,
      "dashLength": 10,
      "dashes": false,
      "datasource": "prometheus",
      "fill": 3,
      "fillGradient": 20,
      "gridPos": {
        "h": 8,
        "w": 12,
        "x": 0,
        "y": 8
      },
      "id": 201,
      "legend": {
        "show": true
      },
      "lines": true,
      "linewidth": 2,
      "targets": [
        {
          "expr": "100 - avg by (mode)(irate(windows_cpu_time_total{instance=\"localhost:9182\"}[1m])) * 100",
          "legendFormat": "{{mode}}",
          "refId": "A"
        }
      ],
      "title": "CPU 详细负载",
      "type": "timeseries",
      "yaxes": [{"max":"100","min":"0","format":"percent"}]
    },
    {
      "aliasColors": {},
      "bars": false,
      "dashLength": 10,
      "dashes": false,
      "datasource": "prometheus",
      "fill": 3,
      "fillGradient": 20,
      "gridPos": {
        "h": 8,
        "w": 12,
        "x": 12,
        "y": 8
      },
      "id": 202,
      "legend": {
        "show": true
      },
      "lines": true,
      "linewidth": 2,
      "targets": [
        {
          "expr": "windows_physical_memory_total_bytes{instance=\"localhost:9182\"}",
          "legendFormat": "总内存",
          "refId": "A"
        },
        {
          "expr": "windows_physical_memory_available_bytes{instance=\"localhost:9182\"}",
          "legendFormat": "空闲内存",
          "refId": "B"
        }
      ],
      "title": "内存详细占用",
      "type": "timeseries"
    },
    {
      "aliasColors": {},
      "bars": false,
      "dashLength": 10,
      "dashes": false,
      "datasource": "prometheus",
      "fill": 3,
      "fillGradient": 20,
      "gridPos": {
        "h": 8,
        "w": 12,
        "x": 0,
        "y": 16
      },
      "id": 203,
      "legend": {
        "show": true
      },
      "lines": true,
      "linewidth": 2,
      "targets": [
        {
          "expr": "windows_logical_disk_size_bytes{instance=\"localhost:9182\",volume=~\"C:\"}",
          "legendFormat": "{{volume}} 总容量",
          "refId": "A"
        },
        {
          "expr": "windows_logical_disk_free_bytes{instance=\"localhost:9182\",volume=~\"C:\"}",
          "legendFormat": "{{volume}} 剩余",
          "refId": "B"
        }
      ],
      "title": "磁盘空间",
      "type": "timeseries"
    },
    {
      "aliasColors": {},
      "bars": false,
      "dashLength": 10,
      "dashes": false,
      "datasource": "prometheus",
      "fill": 3,
      "fillGradient": 20,
      "gridPos": {
        "h": 8,
        "w": 12,
        "x": 12,
        "y": 16
      },
      "id": 204,
      "legend": {
        "show": true
      },
      "lines": true,
      "linewidth": 2,
      "targets": [
        {
          "expr": "irate(windows_network_bytes_total{instance=\"localhost:9182\",direction=\"in\"}[1m])",
          "legendFormat": "下载",
          "refId": "A"
        },
        {
          "expr": "irate(windows_network_bytes_total{instance=\"localhost:9182\",direction=\"out\"}[1m])",
          "legendFormat": "上传",
          "refId": "B"
        }
      ],
      "title": "网络流量 上传/下载",
      "type": "timeseries"
    },
    {
      "collapsed": false,
      "gridPos": {
        "h": 1,
        "w": 24,
        "x": 0,
        "y": 24
      },
      "id": 400,
      "panels": [],
      "title": "🔧 系统深层指标",
      "type": "row"
    },
    {
      "datasource": "prometheus",
      "gridPos": {
        "h": 7,
        "w": 24,
        "x": 0,
        "y": 25
      },
      "id": 205,
      "targets": [
        {
          "expr": "windows_system_uptime{instance=\"localhost:9182\"}",
          "legendFormat": "系统运行时间",
          "refId": "A"
        },
        {
          "expr": "windows_cpu_core_count{instance=\"localhost:9182\"}",
          "legendFormat": "CPU核心数",
          "refId": "B"
        }
      ],
      "title": "系统基础信息",
      "type": "table"
    }
  ],
  "refresh": "5s",
  "schemaVersion": 38,
  "style": "dark",
  "tags": ["windows","炫酷","完整"],
  "templating": {
    "list": []
  },
  "time": {
    "from": "now-30m",
    "to": "now"
  },
  "timepicker": {
    "refresh_intervals": ["5s","10s","30s","1m","5m"]
  },
  "timezone": "Asia/Shanghai",
  "title": "🔥 Windows 完整版·炫酷全功能监控",
  "uid": "win-full-cool",
  "version": 1
}
汇聚全球AI编程工具,助力开发者即刻编程。
更多推荐
 7
7 0
0- 0



 已为社区贡献4条内容

所有评论(0)