
prometheus(7):prometheus主配置文件prometheus.yml
·
在prometheus解压后,就自带一个prometheus.xml
[root@localhost prometheus-2.22.1.linux-amd64]# cat prometheus.yml
# prometheus.yml - 重写并带有详细注释的配置

# 全局配置 (Global Settings)
# 这些设置是 Prometheus 实例的默认值,除非在特定的抓取配置中被覆盖。
global:
  # scrape_interval: 定义了 Prometheus 从目标抓取指标的默认频率。
  # 每 15 秒抓取一次数据。
  scrape_interval: 15s

  # evaluation_interval: 定义了 Prometheus 评估记录规则和告警规则的频率。
  # 每 15 秒评估一次规则。
  evaluation_interval: 15s

  # external_labels: (可选) 添加到所有时间序列和告警的标签,用于与其他系统(如 Alertmanager)交互。
  # 示例:
  # external_labels:
  #   monitor: 'my-prometheus-instance'

# 告警配置 (Alerting Configuration)
# 定义 Prometheus 如何将告警发送到 Alertmanager 实例。
alerting:
  alertmanagers:
    # static_configs: 静态地定义 Alertmanager 实例的地址。
    # 当前目标列表为空,表示虽然配置了告警部分,但实际上没有配置 Alertmanager 实例。
    # 要启用告警,请在此处添加您的 Alertmanager 主机和端口。
    # 示例: targets: ['alertmanager.example.com:9093']
    - static_configs:
        - targets: [] # 未定义 Alertmanager 实例,告警功能实际上处于禁用状态。

# 规则文件 (Rule Files)
# 指定包含告警规则 (alerting rules) 和记录规则 (recording rules) 的文件路径。
# Prometheus 会根据 'evaluation_interval' 定期重新加载这些文件。
rule_files:
  # 当前未指定任何规则文件。将规则文件的路径(例如 *.rules.yml)添加到这里。
  # 示例:
  # - "rules/node_exporter_rules.yml"
  # - "rules/application_rules.yml"
  [] # 空列表表示不加载任何规则。

# 抓取配置 (Scrape Configurations)
# 定义 Prometheus 需要监控的目标(endpoints)。每个 'job' 代表一组具有共同目的的目标。
scrape_configs:
  # 作业 1: 监控 Prometheus 自身
  # 这是标准实践,用于监控 Prometheus 本身的健康状况和性能指标。
  - job_name: 'prometheus'
    # static_configs: 在配置文件中手动、静态地定义目标。
    static_configs:
      - targets: ['localhost:9090'] # Prometheus 的默认端口。

  # 作业 2: 监控 centos7-1 上的 node_exporter
  # node_exporter 提供操作系统和硬件相关的指标。
  - job_name: 'centos7-1'
    static_configs:
      - targets: ['192.168.80.131:9100'] # node_exporter 的默认端口。

  # 作业 3: 监控 centos7-2 上的 node_exporter
  - job_name: 'centos7-2'
    static_configs:
      - targets: ['192.168.80.132:9100']

  # 作业 4: 监控 centos7-3 上的 node_exporter
  - job_name: 'centos7-3'
    static_configs:
      - targets: ['192.168.80.133:9100']

  # 作业 5: 监控 MySQL 主服务器上的 node_exporter
  - job_name: 'mysql-master'
    static_configs:
      - targets: ['192.168.80.141:9100']

  # 作业 6: 监控 MySQL 从服务器 1 上的 node_exporter
  - job_name: 'mysql-slave1'
    static_configs:
      - targets: ['192.168.80.142:9100']

  # --- 已注释掉的配置 ---
  # 以下作业配置当前被注释掉了,处于禁用状态。
  # 它可能原本用于抓取 Grafana、Loki、Promtail 或运行在 192.168.80.151:9091 上的其他服务的指标。
  # 如果需要启用,请移除下面几行开头的 '#' 符号。
  # 抓取 PushGateway 指标
  - job_name: 'flink-pushgateway'
    static_configs:
      - targets: ['192.168.80.151:9091']  # 因为 PushGateway 与 Prometheus 在同一机器

# --- 替代方案提示 ---
# 对于管理大量类似目标(如此处的多个 node_exporter 实例),
# 可以考虑使用服务发现机制(Service Discovery)替代 static_configs,例如:
# - file_sd_configs: 从文件中读取目标列表(JSON 或 YAML 格式)。
# - consul_sd_configs, kubernetes_sd_configs, ec2_sd_configs 等:与 Consul、Kubernetes、AWS EC2 等集成。
# 这样做可以使配置更动态、更易于管理。[root@localhost prometheus-2.22.1.linux-amd64]#
一 全局配置 (Global Settings)
# 全局配置 (Global Settings)
# 这些设置是 Prometheus 实例的默认值,除非在特定的抓取配置中被覆盖。
global:
  # scrape_interval: 定义了 Prometheus 从目标抓取指标的默认频率。
  # 每 15 秒抓取一次数据。
  scrape_interval: 15s

  # evaluation_interval: 定义了 Prometheus 评估记录规则和告警规则的频率。
  # 每 15 秒评估一次规则。
  evaluation_interval: 15s
二 告警配置 (Alerting Configuration)
# 告警配置 (Alerting Configuration)
# 定义 Prometheus 如何将告警发送到 Alertmanager 实例。
alerting:
  alertmanagers:
    # static_configs: 静态地定义 Alertmanager 实例的地址。
    # 当前目标列表为空,表示虽然配置了告警部分,但实际上没有配置 Alertmanager 实例。
    # 要启用告警,请在此处添加您的 Alertmanager 主机和端口。
    # 示例: targets: ['alertmanager.example.com:9093']
    - static_configs:
        - targets: [] # 未定义 Alertmanager 实例,告警功能实际上处于禁用状态。
三 规则文件 (Rule Files)
# 规则文件 (Rule Files)
# 指定包含告警规则 (alerting rules) 和记录规则 (recording rules) 的文件路径。
# Prometheus 会根据 'evaluation_interval' 定期重新加载这些文件。
rule_files:
  # 当前未指定任何规则文件。将规则文件的路径(例如 *.rules.yml)添加到这里。
  # 示例:
  # - "rules/node_exporter_rules.yml"
  # - "rules/application_rules.yml"
  [] # 空列表表示不加载任何规则。
四 抓取配置 (Scrape Configurations)
4.1 静态
9100端口
# 抓取配置 (Scrape Configurations)
# 定义 Prometheus 需要监控的目标(endpoints)。每个 'job' 代表一组具有共同目的的目标。
scrape_configs:
  # 作业 1: 监控 Prometheus 自身
  # 这是标准实践,用于监控 Prometheus 本身的健康状况和性能指标。
  - job_name: 'prometheus'
    # static_configs: 在配置文件中手动、静态地定义目标。
    static_configs:
      - targets: ['localhost:9090'] # Prometheus 的默认端口。

  # 作业 2: 监控 centos7-1 上的 node_exporter
  # node_exporter 提供操作系统和硬件相关的指标。
  - job_name: 'centos7-1'
    static_configs:
      - targets: ['192.168.80.131:9100'] # node_exporter 的默认端口。

  # 作业 3: 监控 centos7-2 上的 node_exporter
  - job_name: 'centos7-2'
    static_configs:
      - targets: ['192.168.80.132:9100']

  # 作业 4: 监控 centos7-3 上的 node_exporter
  - job_name: 'centos7-3'
    static_configs:
      - targets: ['192.168.80.133:9100']

  # 作业 5: 监控 MySQL 主服务器上的 node_exporter
  - job_name: 'mysql-master'
    static_configs:
      - targets: ['192.168.80.141:9100']

  # 作业 6: 监控 MySQL 从服务器 1 上的 node_exporter
  - job_name: 'mysql-slave1'
    static_configs:
      - targets: ['192.168.80.142:9100']

  # --- 已注释掉的配置 ---
  # 以下作业配置当前被注释掉了,处于禁用状态。
  # 它可能原本用于抓取 Grafana、Loki、Promtail 或运行在 192.168.80.151:9091 上的其他服务的指标。
  # 如果需要启用,请移除下面几行开头的 '#' 符号。
  # 抓取 PushGateway 指标
  - job_name: 'flink-pushgateway'
    static_configs:
      - targets: ['192.168.80.151:9091']  # 因为 PushGateway 与 Prometheus 在同一机器
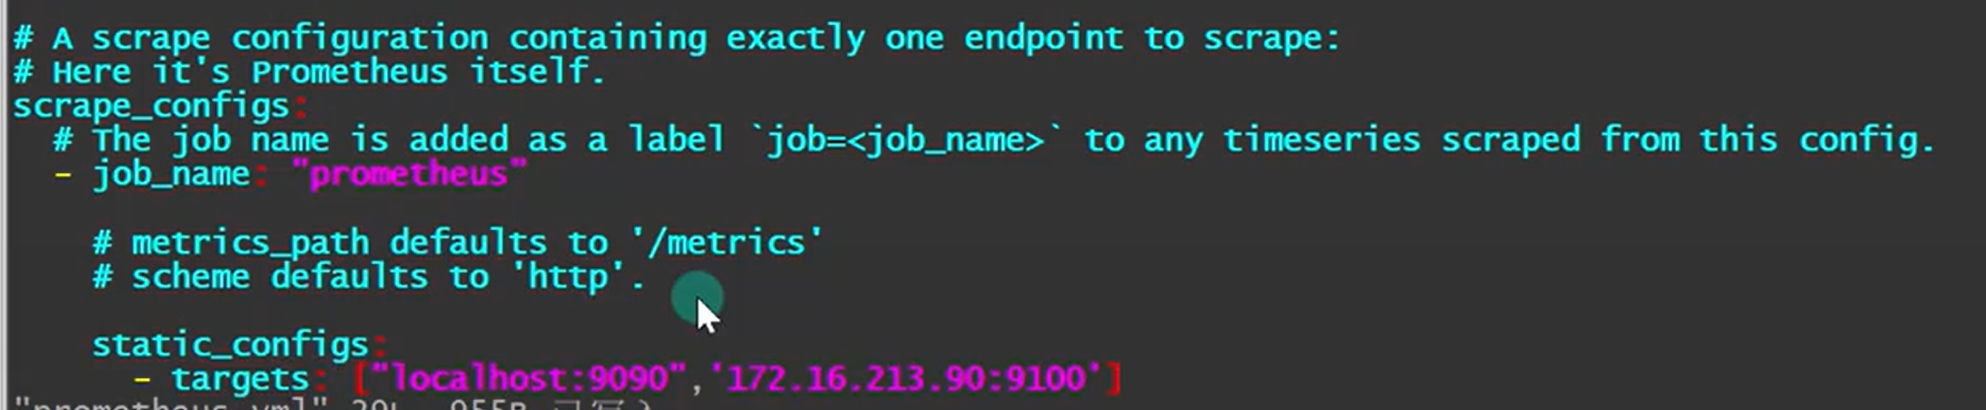
4.2 服务自动发现
9100端口
五 检测文件写的对不对
用promtool这个工具
[root@localhost prometheus-2.22.1.linux-amd64]# ./promtool check config
promtool: error: required argument 'config-files' not provided, try --help
[root@localhost prometheus-2.22.1.linux-amd64]# ./promtool check config prometheus.yml
Checking prometheus.yml
  SUCCESS: 0 rule files found

[root@localhost prometheus-2.22.1.linux-amd64]#

汇聚全球AI编程工具,助力开发者即刻编程。
更多推荐

 1
1 0
0- 0


 已为社区贡献10条内容

所有评论(0)