
监控平台搭建-日志-loki篇(六)
·
要使用 Loki、Loki4j、Grafana 和 Spring Boot 搭建一个轻量级、简单、易用的 Java 日志系统,可以按照如下步骤进行部署。利用 Loki 作为日志存储和聚合,Loki4j 作为 Java 的日志插件,Grafana 用于日志的可视化。
1.工具介绍:
Loki:类似于 Prometheus 的日志系统,但 Loki 并不索引日志的内容,而是通过标签(label)进行索引,使用 PromQL 进行查询,轻量级且高效;
Loki4j:一个适用于 Java 项目的日志库,可以将 Spring Boot 项目的日志直接推送到 Loki;
Grafana:前文已部署,部署loki后还可以用于可视化 Loki 中存储的日志,并提供查询、分析和展示日志的功能;
Spring Boot:作为 Java 应用框架,用于生成日志并集成 Loki4j 进行日志传输。
2.系统架构:
Spring Boot 应用程序通过 Loki4j 生成和发送日志;
Loki 作为日志聚合和存储系统接收日志中间件;
Grafana 用于展示和可视化 Loki 中存储的日志。
3. loki搭建步骤
本文版本:2.9.3,源码位置:https://github.com/grafana/loki
3.1.步骤 1:创建目录logs、data、config、script,如下
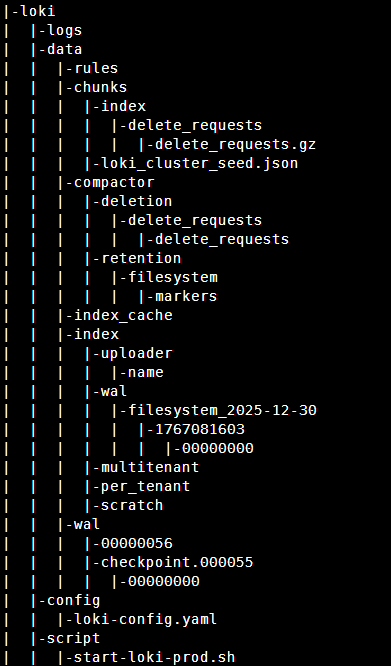
3.2添加配置文件
#添加配置
vim config/loki-config.yaml
# 生产优化配置
auth_enabled: false

server:
  http_listen_port: 13100
  grpc_listen_port: 19096
  http_server_read_timeout: 300s
  http_server_write_timeout: 300s
  grpc_server_max_recv_msg_size: 104857600  # 100MB
  grpc_server_max_send_msg_size: 104857600

common:
  path_prefix: /loki/data
  storage:
    filesystem:
      chunks_directory: /loki/data/chunks
      rules_directory: /loki/data/rules
  replication_factor: 1
  ring:
    instance_addr: 127.0.0.1
    kvstore:
      store: inmemory
    heartbeat_timeout: 1m
    heartbeat_period: 10s

# 查询优化
query_range:
  #split_queries_by_interval: 1h
  results_cache:
    cache:
      embedded_cache:
        enabled: true
        max_size_mb: 1024
        ttl: 1h
  parallelise_shardable_queries: true
  max_retries: 5

# 存储配置
schema_config:
  configs:
    - from: 2025-12-30
      store: tsdb
      object_store: filesystem
      schema: v13
      index:
        prefix: index_
        period: 24h

storage_config:
  tsdb_shipper:
    active_index_directory: /loki/data/index
    cache_location: /loki/data/index_cache
    shared_store: filesystem
#    max_concurrent_downloads: 20
#    download_parallelism: 10

  filesystem:
    directory: /loki/data/chunks

  boltdb_shipper:
    active_index_directory: /loki/data/index_legacy
    cache_location: /loki/data/index_cache_legacy

# 性能调优
limits_config:
  split_queries_by_interval: 1h
  reject_old_samples: true
  reject_old_samples_max_age: 168h
  max_query_length: 720h
  max_query_parallelism: 64
  max_streams_per_user: 10000
  max_global_streams_per_user: 0
  max_line_size: 256000
  max_entries_limit_per_query: 5000
  retention_period: 720h
  per_stream_rate_limit: 10MB
  per_stream_rate_limit_burst: 20MB

  ingestion_rate_mb: 50
  ingestion_burst_size_mb: 100

  # 租户限制
  enforce_metric_name: false
  max_label_names_per_series: 30
  max_label_name_length: 1024
  max_label_value_length: 2048

# 压缩和保留
compactor:
  working_directory: /loki/data/compactor
  shared_store: filesystem
  compaction_interval: 10m
  retention_enabled: true
  retention_delete_delay: 2h
  retention_delete_worker_count: 10

# 查询前端
frontend:
  max_outstanding_per_tenant: 1000
  compress_responses: true

# 日志配置
#logging:
#  level: info
#  format: json

# 追踪
tracing:
  enabled: false
3.3添加启动脚本
vim script/loki-config.yaml
et -e

# 环境变量
LOKI_VERSION="2.9.3"
DATA_DIR="/xworks/monitor/loki/data"
CONFIG_DIR="/xworks/monitor/loki/config"
LOGS_DIR="/xworks/monitor/loki/logs"
CONTAINER_NAME="loki-prod"

# 检查目录
echo "检查目录权限..."
mkdir -p ${DATA_DIR} ${CONFIG_DIR} ${LOGS_DIR}
chmod 755 ${DATA_DIR} ${CONFIG_DIR} ${LOGS_DIR}

# 停止旧容器
echo "停止旧容器..."
docker stop ${CONTAINER_NAME} 2>/dev/null || true
docker rm ${CONTAINER_NAME} 2>/dev/null || true

# 拉取镜像
echo "拉取 Loki ${LOKI_VERSION} 镜像..."
docker pull grafana/loki:${LOKI_VERSION}

# 启动容器
echo "启动 Loki 容器..."

docker run -d \
  --name=${CONTAINER_NAME} \
  --restart=unless-stopped \
  --memory="2g" \
  --cpus="1.0" \
  --ulimit nofile=65536:65536 \
  --health-cmd="wget --quiet --tries=1 --spider http://localhost:13100/ready 2>/dev/null || exit 1" \
  --health-interval=30s \
  --health-timeout=10s \
  --health-retries=3 \
  --health-start-period=60s \
  --publish 13100:13100 \
  --publish 19096:19096 \
  --volume ${CONFIG_DIR}:/etc/loki:ro \
  --volume ${DATA_DIR}:/loki/data \
  --volume ${LOGS_DIR}:/var/log/loki \
  --env TZ=Asia/Shanghai \
  --env "LOKI_ADDR=0.0.0.0" \
  --label "environment=production" \
  --label "version=${LOKI_VERSION}" \
  grafana/loki:${LOKI_VERSION} \
  -config.file=/etc/loki/loki-config.yaml \
  -log.level=info \
  -log.format=json \
  -target=all

# 等待启动
echo "等待服务启动..."
sleep 10

# 验证
echo "验证服务状态..."
if curl -s http://127.0.0.1:13100/ready | grep -q "ready"; then
    echo "✅ Loki 启动成功!"
    echo "HTTP端口: 13100"
    echo "gRPC端口: 19096"
    echo "数据目录: ${DATA_DIR}"
    echo "日志目录: ${LOGS_DIR}"
else
    echo "❌ Loki 启动失败,查看日志:"
    docker logs ${CONTAINER_NAME} --tail 20
    exit 1
fi

# 监控信息
echo ""
echo "监控端点:"
echo "- 健康检查: http://localhost:13100/ready"
echo "- 指标数据: http://localhost:13100/metrics"
echo "- 运行时配置: http://localhost:13100/runtime_config"
echo "- 集群状态: http://localhost:13100/loki/api/v1/status/cl"
启动完成后,本身我控制台界面,可通过如下脚本查看启动状态




汇聚全球AI编程工具,助力开发者即刻编程。
更多推荐


 6
6 0
0- 0


 已为社区贡献1条内容

所有评论(0)