
prometheus告警-以CPU使用率告警为例
无论你是学习go的还是学习ts,欢迎加入wedm开发团队 : https://github.com/andrewbytecoder/wedm
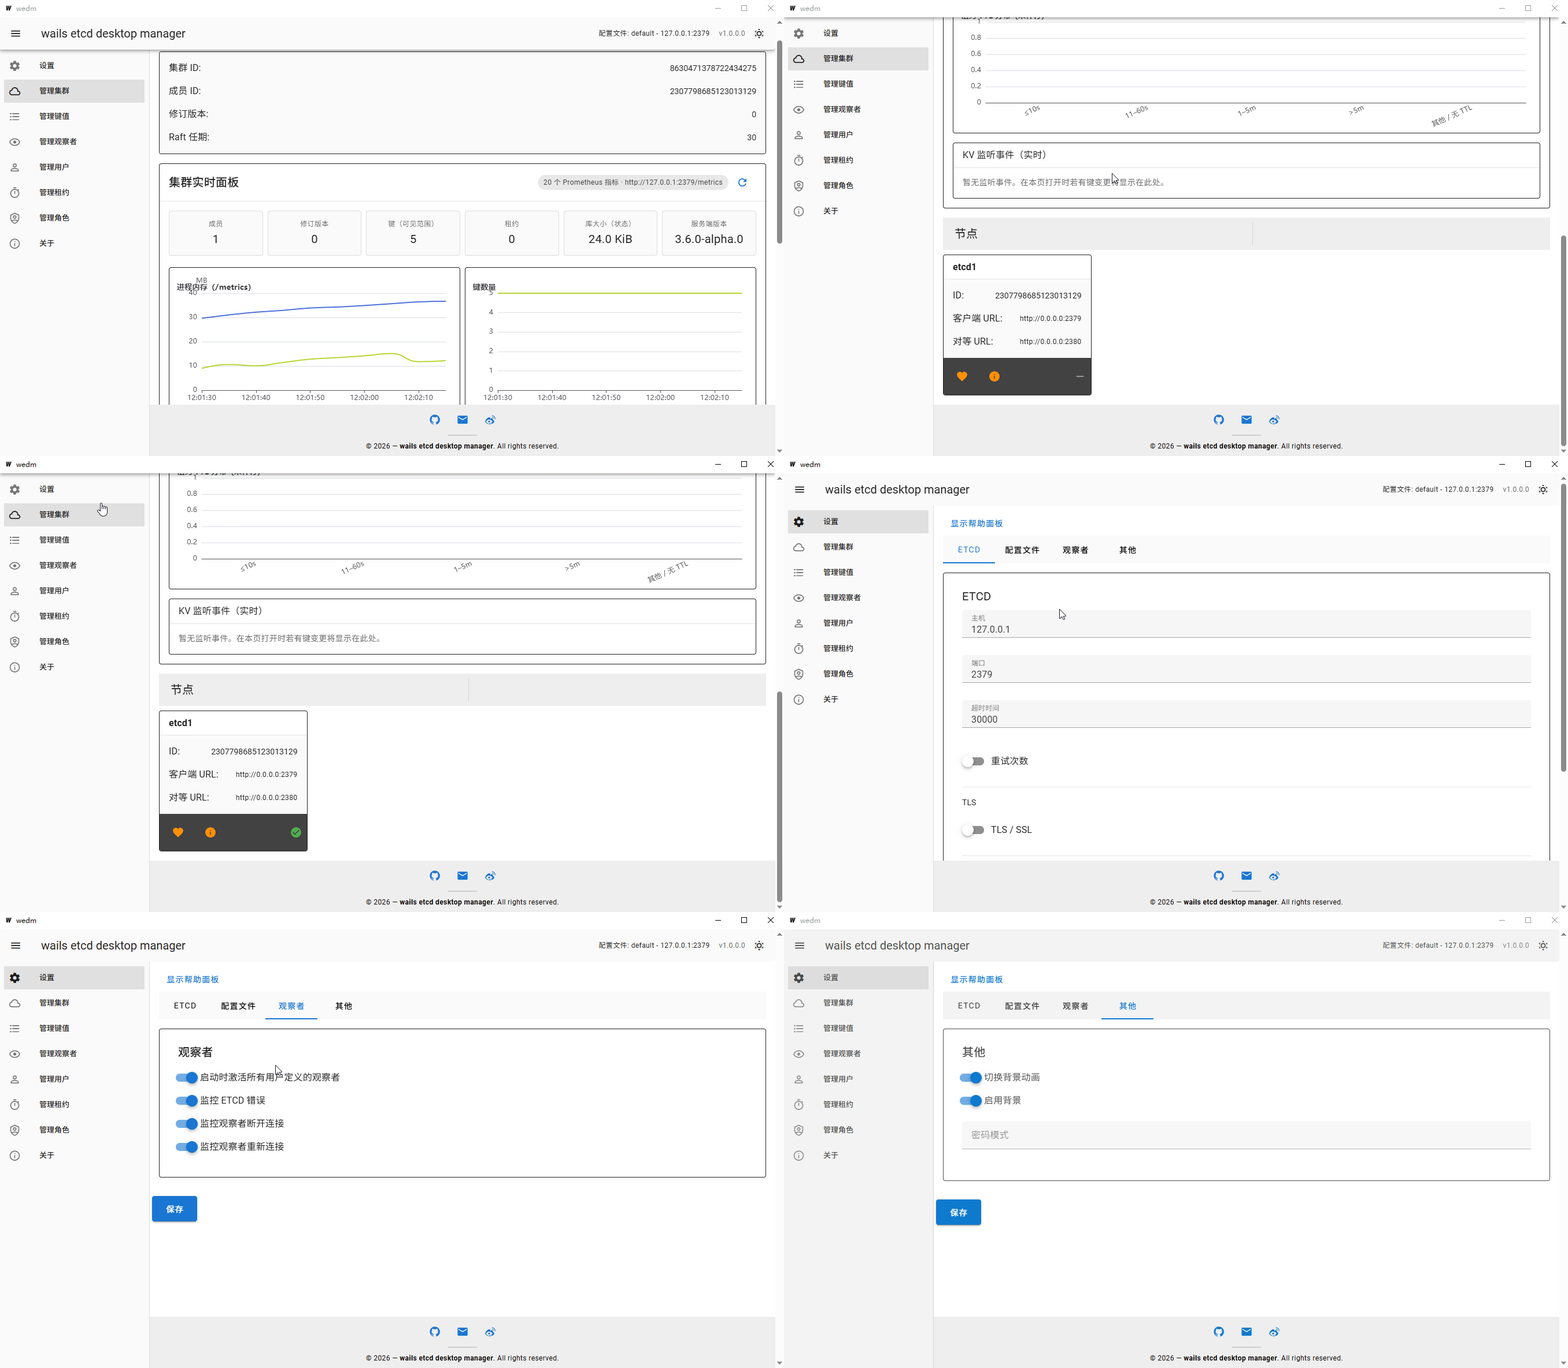
WEDM 是一个免费、跨平台的 ETCD v3 客户端和图形界面工具,基于 Wails v2、Go 和 Vue 3 构建。
本项目的目标是为 Windows、Linux 和 macOS 提供一个高效、现代化的桌面应用程序,覆盖 ETCD 的所有功能。凡是你能够使用 etcdctl 完成的操作,都应该能够通过本工具轻松实现。
以一个完整的告警流程为例,从配置到具体告警的整个流程,详细剖析各个环节
整体流程的时序图如下:
配置
prometheus中关于告警的配置如下,主要包含两部分,一个是告警labels管理部分,主要进行labels的替换重命名过滤等操作,另外一部分是指定可用的告警器。
// AlertingConfig configures alerting and alertmanager related configs.type
AlertingConfig struct {
    // 告警 labels relabel  config
    AlertRelabelConfigs []*relabel.Config `yaml:"alert_relabel_configs,omitempty"`
    // Alertmanager configs
    AlertmanagerConfigs AlertmanagerConfigs `yaml:"alertmanagers,omitempty"`
}
relabel.Config
// Config is the configuration for relabeling of target label sets.type Config
struct {
    // A list of labels from which values are taken and concatenated
    // with the configured separator in order.
    SourceLabels model.LabelNames `yaml:"source_labels,flow,omitempty" json:"sourceLabels,omitempty"`
    // Separator is the string between concatenated values from the source labels.    // 将标签的value值进行合并时,使用的分隔符
    Separator string `yaml:"separator,omitempty" json:"separator,omitempty"`
    // Regex against which the concatenation is matched.
    // Default is '(.*)'.
    Regex Regexp `yaml:"regex,omitempty" json:"regex,omitempty"`
    // Modulus to take of the hash of concatenated values from the source labels.
    Modulus uint64 `yaml:"modulus,omitempty" json:"modulus,omitempty"`
    // TargetLabel is the label to which the resulting string is written in a replacement.    // Regexp interpolation is allowed for the replace action.
    TargetLabel string `yaml:"target_label,omitempty" json:"targetLabel,omitempty"`
    // Replacement is the regex replacement pattern to be used.    // 匹配成功则将匹配到的内容进行替换,默认为$1
    Replacement string `yaml:"replacement,omitempty" json:"replacement,omitempty"`
    // Action is the action to be performed for the relabeling.
    Action Action `yaml:"action,omitempty" json:"action,omitempty"`
}
AlertmanagerConfigs
// AlertmanagerConfigs is a slice of *AlertmanagerConfig.
type AlertmanagerConfigs []*AlertmanagerConfig

// AlertmanagerConfig configures how Alertmanagers can be discovered and communicated with.
type AlertmanagerConfig struct {
	// We cannot do proper Go type embedding below as the parser will then parse
	// values arbitrarily into the overflow maps of further-down types.

	ServiceDiscoveryConfigs discovery.Configs       `yaml:"-"`
	HTTPClientConfig        config.HTTPClientConfig `yaml:",inline"`
	SigV4Config             *sigv4.SigV4Config      `yaml:"sigv4,omitempty"`

	// The URL scheme to use when talking to Alertmanagers.
	Scheme string `yaml:"scheme,omitempty"`
	// Path prefix to add in front of the push endpoint path.
	PathPrefix string `yaml:"path_prefix,omitempty"`
	// The timeout used when sending alerts.
	Timeout model.Duration `yaml:"timeout,omitempty"`

	// The api version of Alertmanager.
	APIVersion AlertmanagerAPIVersion `yaml:"api_version"`

	// List of Alertmanager relabel configurations.
	RelabelConfigs []*relabel.Config `yaml:"relabel_configs,omitempty"`
	// Relabel alerts before sending to the specific alertmanager.
	AlertRelabelConfigs []*relabel.Config `yaml:"alert_relabel_configs,omitempty"`
}
配置示例
alerting:
  alertmanagers:
  # 静态告警配置
  - static_configs:
    # 以下填写自己的告警器地址,这里使用的是在本机启动的alertmanager,监听的端口 9093
    - targets:
      - localhost:9093
   # 可选:配置警报重标记
  alert_relabel_configs:
  # 实际告警时,有些labels可能需要过滤或者隐藏或者进行替换,这个时候就需要使用 alert_relabel_configs
  # source_labels 指明哪些lables需要处理
    - source_labels: [instance]
      regex: '([^:]+):\d+'
      target_label: hostname
      replacement: $1
关于alertmanagers字段怎样解析的可以阅读代码:
func readConfigs(structVal reflect.Value, startField int) (Configs, error) {
	var (
		configs Configs
		targets []*targetgroup.Group
	)
	for i, n := startField, structVal.NumField(); i < n; i++ {
		field := structVal.Field(i)
		if field.Kind() != reflect.Slice {
			panic("discovery: internal error: field is not a slice")
		}
		for k := 0; k < field.Len(); k++ {
			val := field.Index(k)
			if val.IsZero() || (val.Kind() == reflect.Ptr && val.Elem().IsZero()) {
				key := configFieldNames[field.Type().Elem()]
				key = strings.TrimPrefix(key, configFieldPrefix)
				return nil, fmt.Errorf("empty or null section in %s", key)
			}
			switch c := val.Interface().(type) {
			case *targetgroup.Group:
				// Add index to the static config target groups for unique identification
				// within scrape pool.
				c.Source = strconv.Itoa(len(targets))
				// Coalesce multiple static configs into a single static config.
				targets = append(targets, c)
			case Config:
				configs = append(configs, c)
			default:
				panic("discovery: internal error: slice element is not a Config")
			}
		}
	}
	if len(targets) > 0 {
		configs = append(configs, StaticConfig(targets))
	}
	return configs, nil
}
以下是对 alert_relabel_configs 配置的详细解析
alert_relabel_configs:
  # 实际告警时,有些labels可能需要过滤或者隐藏或者进行替换,这个时候就需要使用 alert_relabel_configs
  # source_labels 指明哪些lables需要处理
    - source_labels: [instance]
      # 使用正则表达式匹配values
      regex: '([^:]+):\d+'
      # 将匹配的labels的key替换成 hostname
      target_label: hostname
      # 将匹配的values替换成 首个正则匹配的值, 这里就是 ([^:]+) 匹配的值
      # 如果value的值是 localhost:9100,那么这里匹配的就是 localhost
      replacement: $1
      # Action 没有指定默认是替换 replace,这里的替换是 将对应lable替换成指定内容,如果是向剔除掉对应的label可以指定Action为 labeldrop
replace只是使用新的label替换原先的label,在保留原先label存在的情况下,新增一个label
举个例子
node_cpu_seconds_total 指标的完整数据如下:
node_cpu_seconds_total{cpu="0", instance="localhost:9100", job="node_export", mode="idle"}
经过以上relable处理,告警给alertmanger的数据就会变成
node_cpu_seconds_total{cpu="0", instance="localhost:9100", hostname="localhost", job="node_export", mode="idle"}
环境搭建:
给prometheus配置个告警,当系统CPU使用率大于 10%的时候就进行告警
- 将添加告警rules配置
环境搭建过程中是使用docker-compose搭建的,因此这里需要将本地的告警配置文件先通过docker-compose.yml挂在到prometheus容器内部
services:
  prometheus-compose:
    image: prom/prometheus
    container_name: prometheus-compose
    volumes:
      - ./yaml/prometheus/:/prometheus/
        # 本地的告警规则放到了 ./yaml/prometheus/rules/
      - ./yaml/prometheus/rules/:/prometheus/rules/
      - ./data:/prometheus/data
    command:
      - --web.listen-address=:9800
    network_mode: host
    pid: host
    depends_on:
      - node_exporter
- 创建alert_rules.yml并添加告警规则
groups:
  - name: host_alerts
    rules:
      # CPU 使用率警报
      - alert: HighCPUUsage
        expr: |
          100 - (
            avg by(instance) (
              rate(node_cpu_seconds_total{mode="idle"}[5m])
            ) * 100
          ) > 10
        for: 30s  # 持续30s才触发
        labels:
          severity: warning
          team: infrastructure
          alert_type: resource
        annotations:
          summary: "高CPU使用率 (实例 {{ $labels.instance }})"
          description: |
            {{ $labels.instance }} 的CPU使用率超过10%。
            当前值: {{ $value | printf "%.2f" }}%
            阈值: 10%
          dashboard: " http://localhost:3000/d/node-exporter-full "
          runbook: " https://example.com/runbooks/high-cpu-usage "
- 在promehteus的配置字段rule_files中指定告警配置
global:
rule_files:
  - /prometheus/rules/alert_rules.yml
- 创建alertmanager.yml配置
global:
  # 全局配置
  smtp_smarthost: 'smtp.gmail.com:587'  # 如果使用邮件通知
  smtp_from: 'alerts@example.com'
  smtp_auth_username: 'your-email@gmail.com'
  smtp_auth_password: 'your-app-password'
  smtp_require_tls: true
# 路由配置
route:
  group_by: ['alertname', 'severity', 'instance']
  group_wait: 30s      # 等待时间,收集同一组的警报
  group_interval: 5m   # 同一组警报发送间隔
  repeat_interval: 4h  # 重复警报发送间隔
  receiver: 'default-receiver'

  # 子路由(可根据标签路由到不同接收器)
  routes:
    - match:
        severity: critical
      receiver: 'critical-receiver'
      group_wait: 10s
      repeat_interval: 30m

    - match:
        severity: warning
      receiver: 'warning-receiver'
      group_wait: 1m
      repeat_interval: 2h

# 抑制规则(减少重复警报)
inhibit_rules:
  - source_match:
      severity: 'critical'
    target_match:
      severity: 'warning'
    equal: ['alertname', 'instance']

# 接收器配置
receivers:
  # 默认接收器(Webhook 示例)
  - name: 'default-receiver'
    webhook_configs:
      - url: 'http://webhook.site/your-unique-url'  # 测试用
        send_resolved: true

    # 邮件通知(可选)
    email_configs:
      - to: 'admin@example.com'
        send_resolved: true
        headers:
          subject: '[{{ .Status | toUpper }}] {{ .GroupLabels.alertname }}'

  # 关键警报接收器
  - name: 'critical-receiver'
    webhook_configs:
      - url: 'http://webhook.site/critical-alerts'
        send_resolved: true
    email_configs:
      - to: 'oncall-team@example.com'
        send_resolved: true

  # 警告接收器
  - name: 'warning-receiver'
    webhook_configs:
      - url: 'http://webhook.site/warning-alerts'
        send_resolved: true
- 使用chaosblade创建CPU异常,保证CPU使用率能大于10%
./blade create cpu load --cpu-percent 30
- 以上工作做完我们就可以启动prometheus了
因为使用的是prometheus-compose因此启动环境很简单,只需要在docker-compose.yml文件所在的文件夹执行 docker-compose up -d 就可以
告警数据分析
告警发生时我们会在alertmanager界面上看到如下告警信息

我们逐个字段分析下这些信息的来源
-
alertname=“HighCPUUsage”
alertname=“HighCPUUsage”,alertname来自告警规则 alert_rules.yml中的 groups.rules.alert字段,用来标识告警是由哪个告警规则产生的 -
instance=“localhost:9100”
instance 是node_cpu_seconds_total指标本身自带的标签 -
severity=“warning”
severity 来自告警规则 alert_rules.yml中的 groups.rules.labels.severity,定义告警规则时,可以指定新的labels,这些labels以及指标经过告警规则处理之后自带的labels都能被alertmanager作为告警路由组划分的依据,比如这里是按照 group_by: [‘alertname’, ‘severity’, ‘instance’] 三个字段进行告警组划分,一旦告警组划分之后就可以对这个逻辑组绑定一些共用的告警规则 -
alert_type=“resource”
alert_type 来自告警规则的配置
-
hostname=“localhost”
hostname来自 promtheus的告警信息relabel -
team=“infrastructure”
来自告警器配置
对告警信息进行抓包可以看到告警上报的信息如下:
因为中文编码有问题,其中的 …就是中文注释部分
[
    {
        "annotations": {
            "dashboard": " http://localhost:3000/d/node-exporter-full ",
            "description": "localhost:9100 ...CPU...............10%...\n.........: 30.24%\n......: 10%\n",
            "runbook": " https://example.com/runbooks/high-cpu-usage ",
            "summary": "...CPU......... (...... localhost:9100)"
        },
        "endsAt": "2026-03-07T08:35:58.194Z",
        "startsAt": "2026-03-07T08:31:58.194Z",
        "generatorURL": "http://andrew:9800/graph?g0.expr=100+-+%28avg+by+%28instance%29+%28rate%28node_cpu_seconds_total%7Bmode%3D%22idle%22%7D%5B5m%5D%29%29+%2A+100%29+%3E+10&g0.tab=1",
        "labels": {
            "alert_type": "resource",
            "alertname": "HighCPUUsage",
            "hostname": "localhost",
            "instance": "localhost:9100",
            "severity": "warning",
            "team": "infrastructure"
        }
    }
]

汇聚全球AI编程工具,助力开发者即刻编程。
更多推荐

 8
8 0
0- 0


 已为社区贡献2条内容

所有评论(0)