
prometheus(8):node exporter的介绍
所有可以向prometheus提供监控样本的程序被称为一个Exporter,Expoter的一个实际例子被称为一个target。Prometheus通过轮询的方式从这些target中获取样本数据
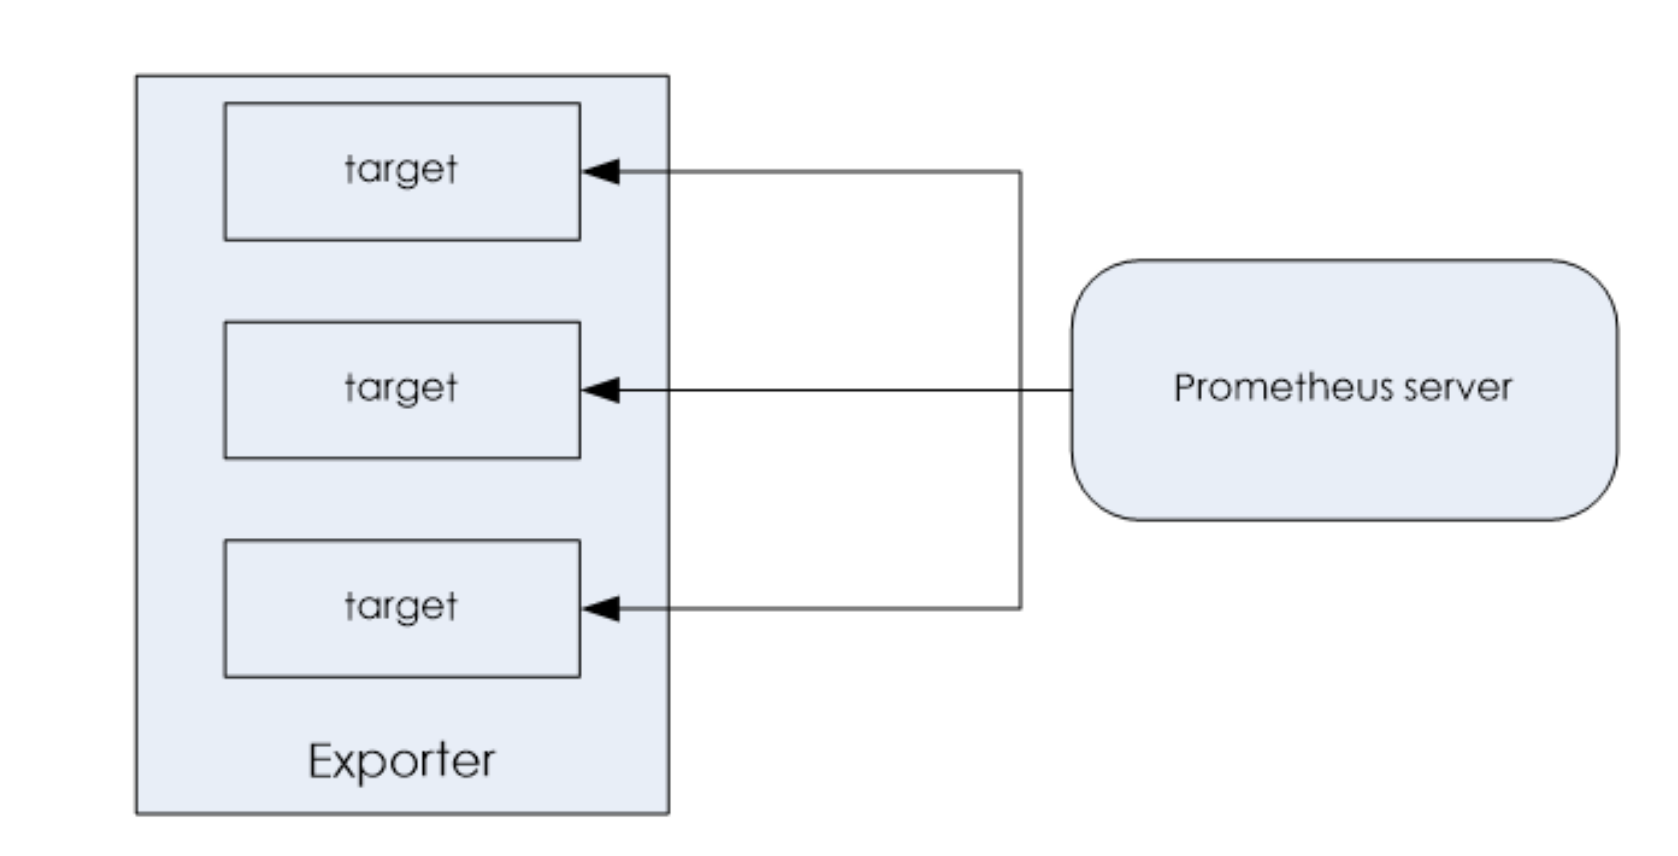
一 exporter分成两种
社区提供的,用户自定义的。主要功能就是监控基础设施、中间件以及网络。
1.1 社区常用expoter
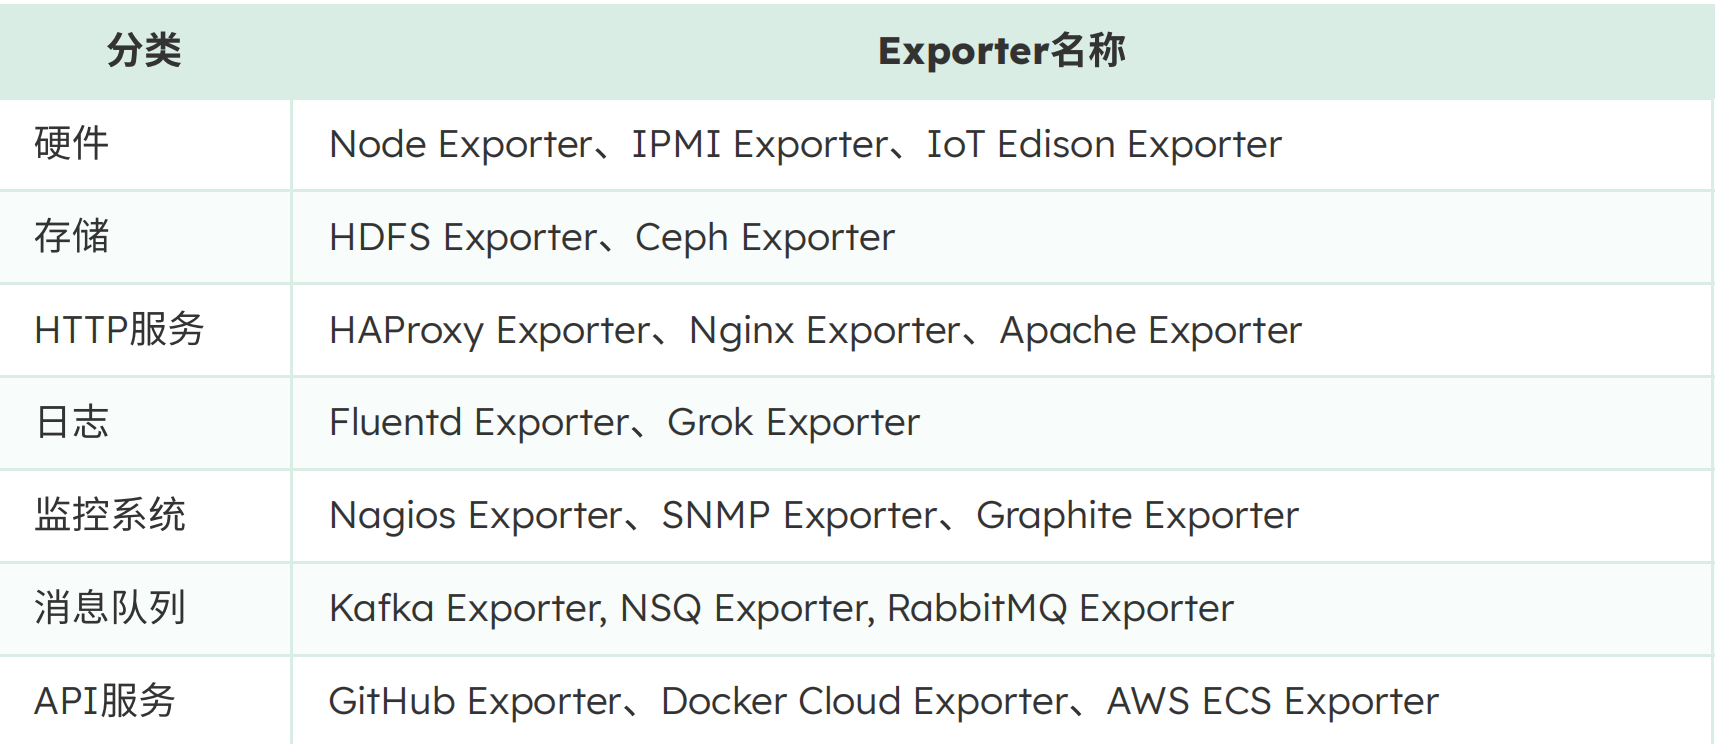
可以去这个网站上查看
https://prometheus.io/docs/instrumenting/exporters/
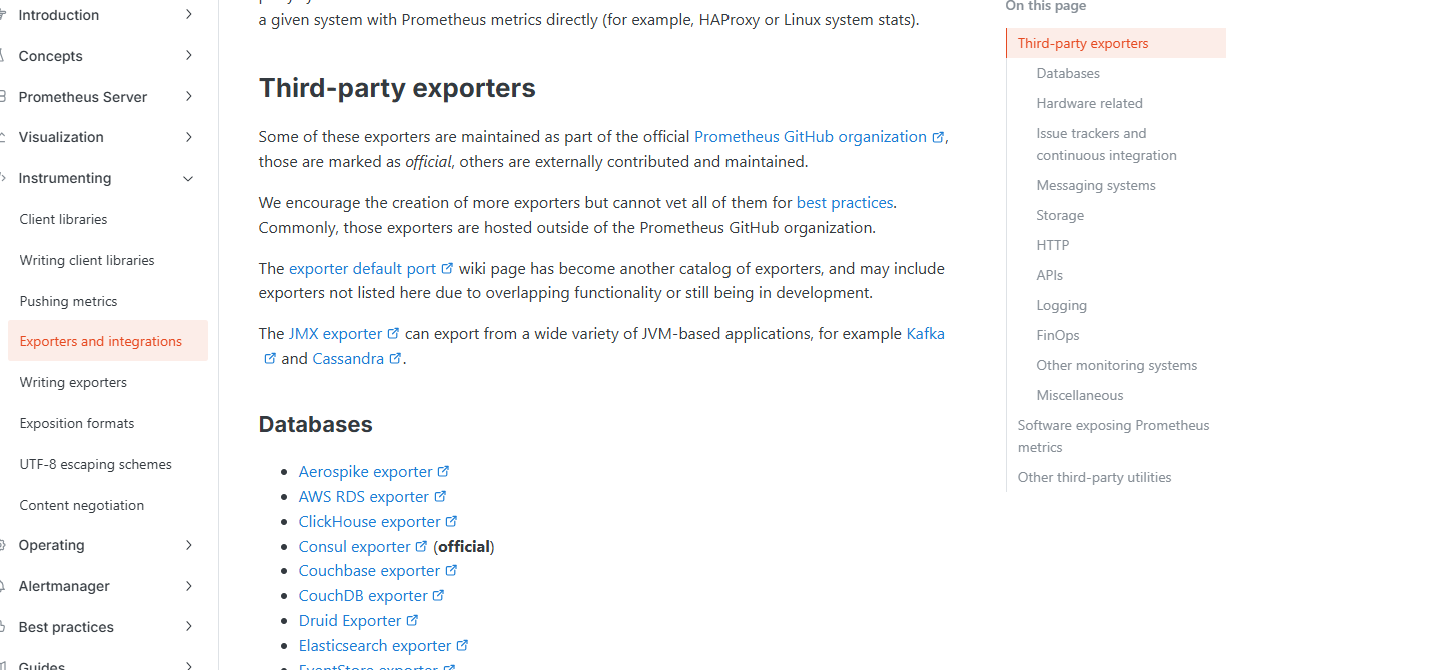
1.2 用户自定义的
我们除了可以直接使⽤社区提供的Exporter以外,还可以基于Prometheus提供的Client Library创建
适合⾃⼰的Exporter程序,⽬前Promthues社区官⽅提供了对以下编程语⾔的⽀持:Python 、Go、
Java/Scala、Ruby等。同时还有第三⽅实现的如:Bash、C++、Lua、Node.js、PHP、Rust等。
二 node exporter介绍
node exporter主要用于采集被监控主机上的CPU负载、内存使用情况。上报数据给prometheus server,node exporter以http_server的方式运行在后台
1.1 下载 node_exporter
[root@localhost ~]# tar zxvf node_exporter-1.5.0.linux-amd64.tar.gz
[root@localhost ~]# mv node_exporter-1.5.0.linux-amd64 /usr/local/node_exporter
[root@localhost ~]# cd /usr/local/node_exporter
[root@localhost node_exporter]# nohup ./node_exporter &

为了自己监控自己
运⾏起来以后 我们使⽤“netstats -tnlp”命令可以来看下 node_exporter进程的状态,node_exporter
默认监听在9100端⼝,要关闭被监控机上的防⽕墙、selinux等,确保node_exporter可以响应
prometheus_server发过来的HTTP_GET请求,也可以响应其他⽅式的HTTP_GET请求,最简单的⽅
式,在浏览器打开:http://“node_exporter所在服务器的IP地址”:9100/metrics , 看是否有初始
Node Exporter监控指标⽣成。
1.2 执行监控脚本
dameload
start
ps
查看metrics页面
三 查看时间序列
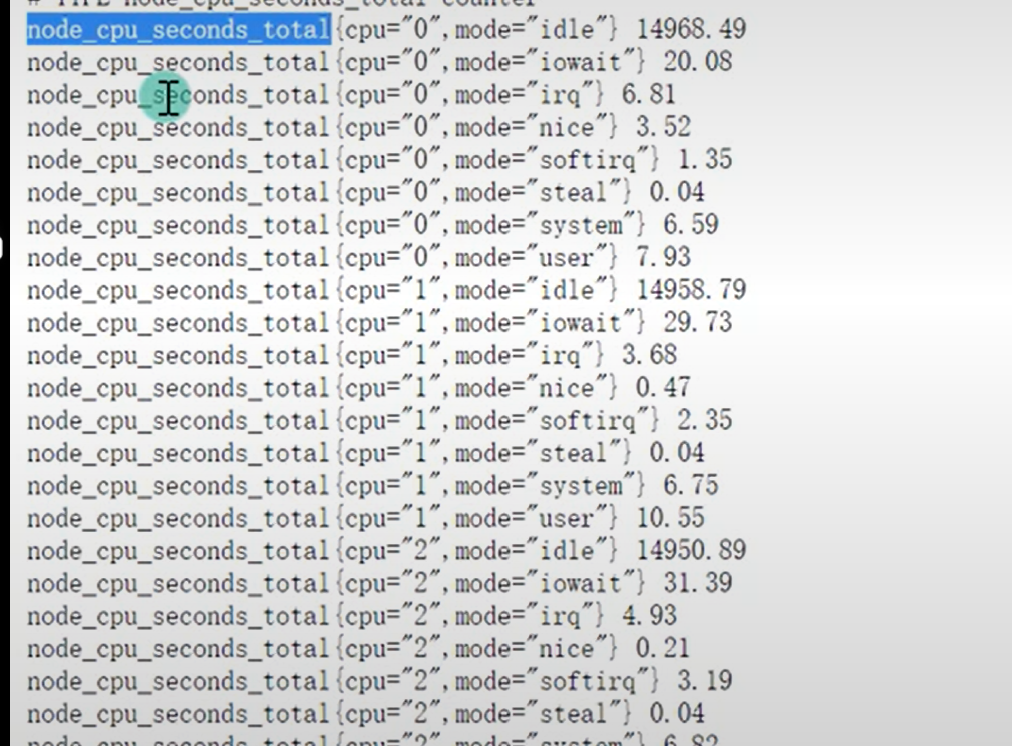
3.1 查看CPU时间序列
3.2 prometheus采集系统启动时间信息
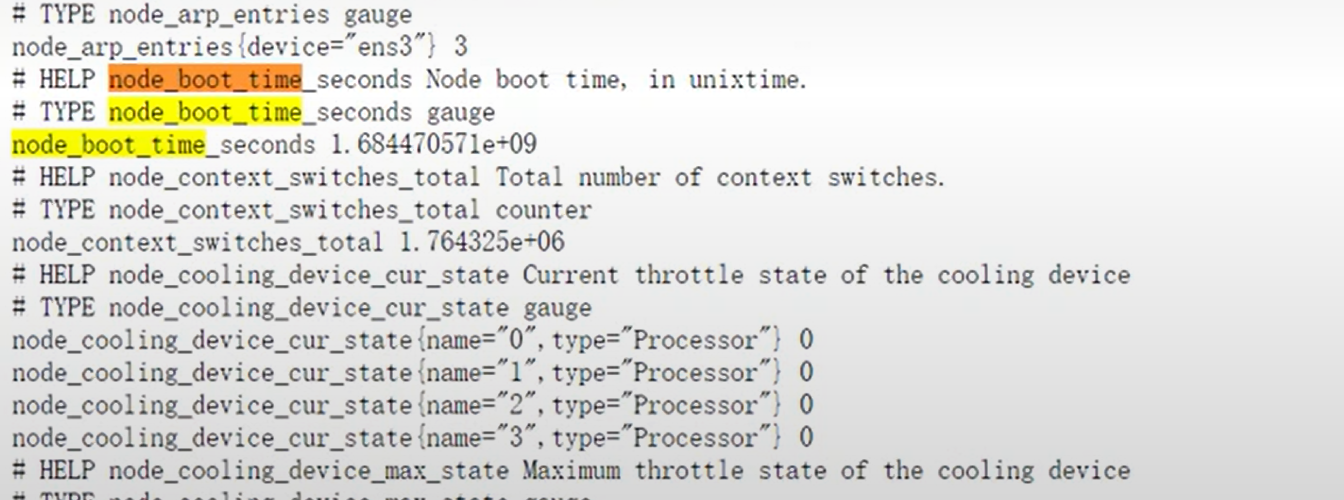
3.3 监控进程
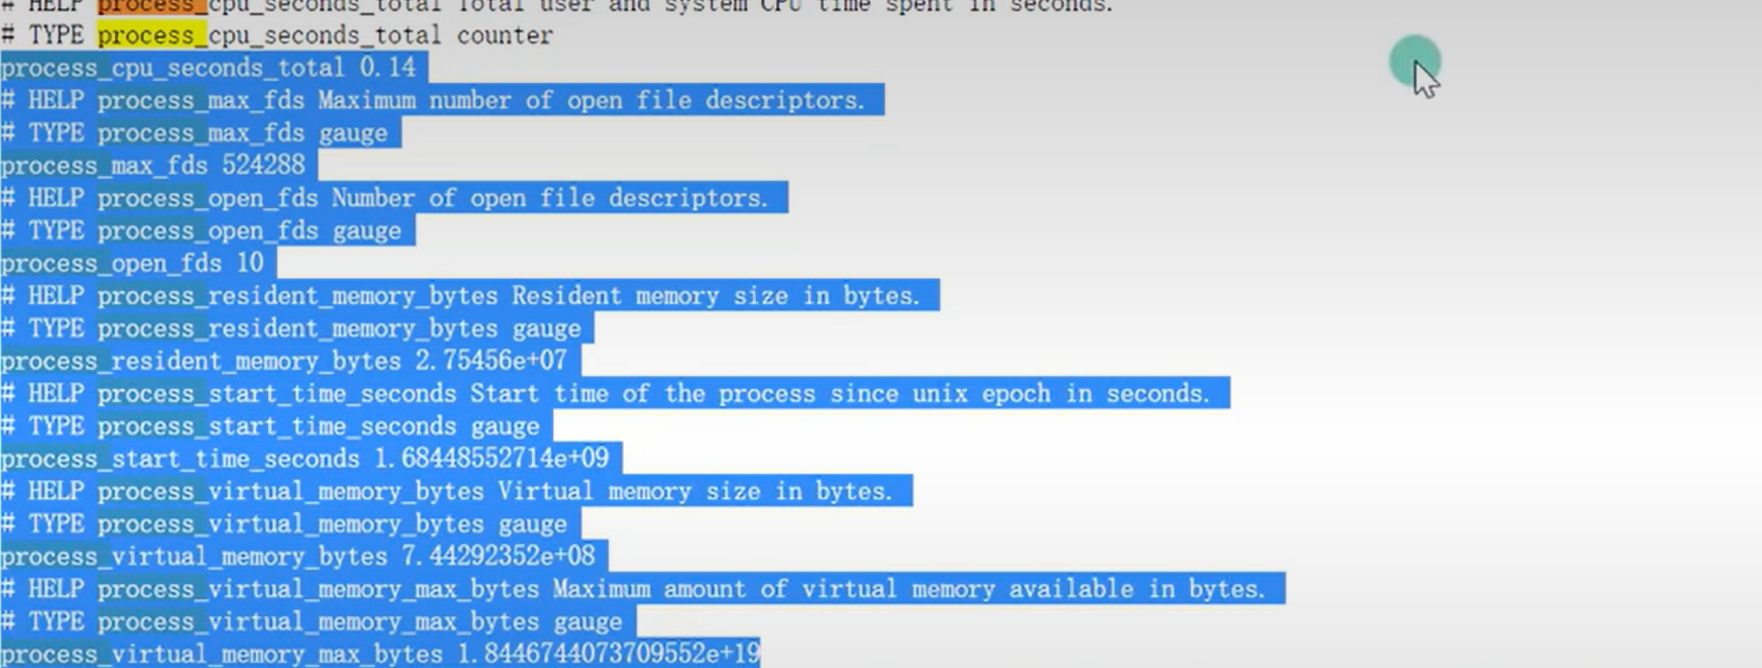
四 修改监控进程的方式
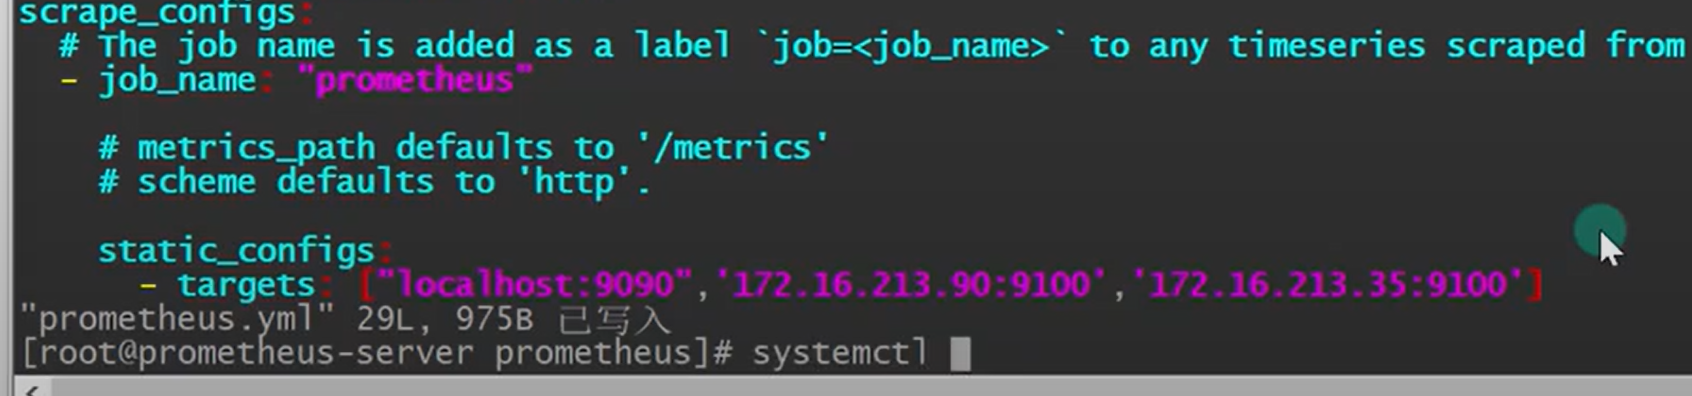
4.1 启动服务
nohup ./prometheus --config.file=prometheus.yml --web.listen-address="0.0.0.0:9090" > prometheus.log 2>&1 &
[root@localhost prometheus-2.22.1.linux-amd64]# nohup ./prometheus --config.file=prometheus.yml --web.listen-address="0.0.0.0:9090" > prometheus.log 2>&1 &
[1] 2036
[root@localhost prometheus-2.22.1.linux-amd64]# pd
-bash: pd: 未找到命令
[root@localhost prometheus-2.22.1.linux-amd64]# ps
   PID TTY          TIME CMD
  1996 pts/0    00:00:00 bash
  2036 pts/0    00:00:05 prometheus
  2045 pts/0    00:00:00 ps
[root@localhost prometheus-2.22.1.linux-amd64]#
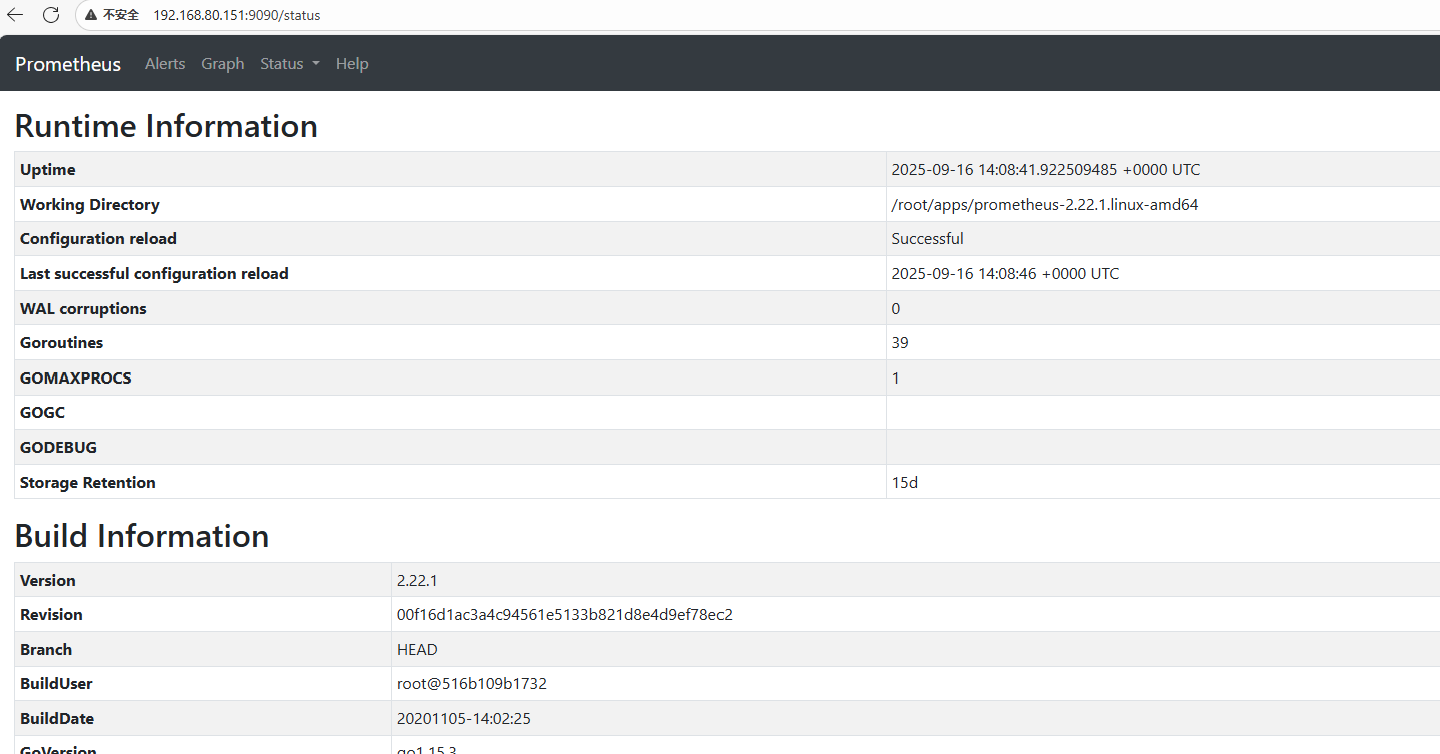
4.2 搜索prometheus服务
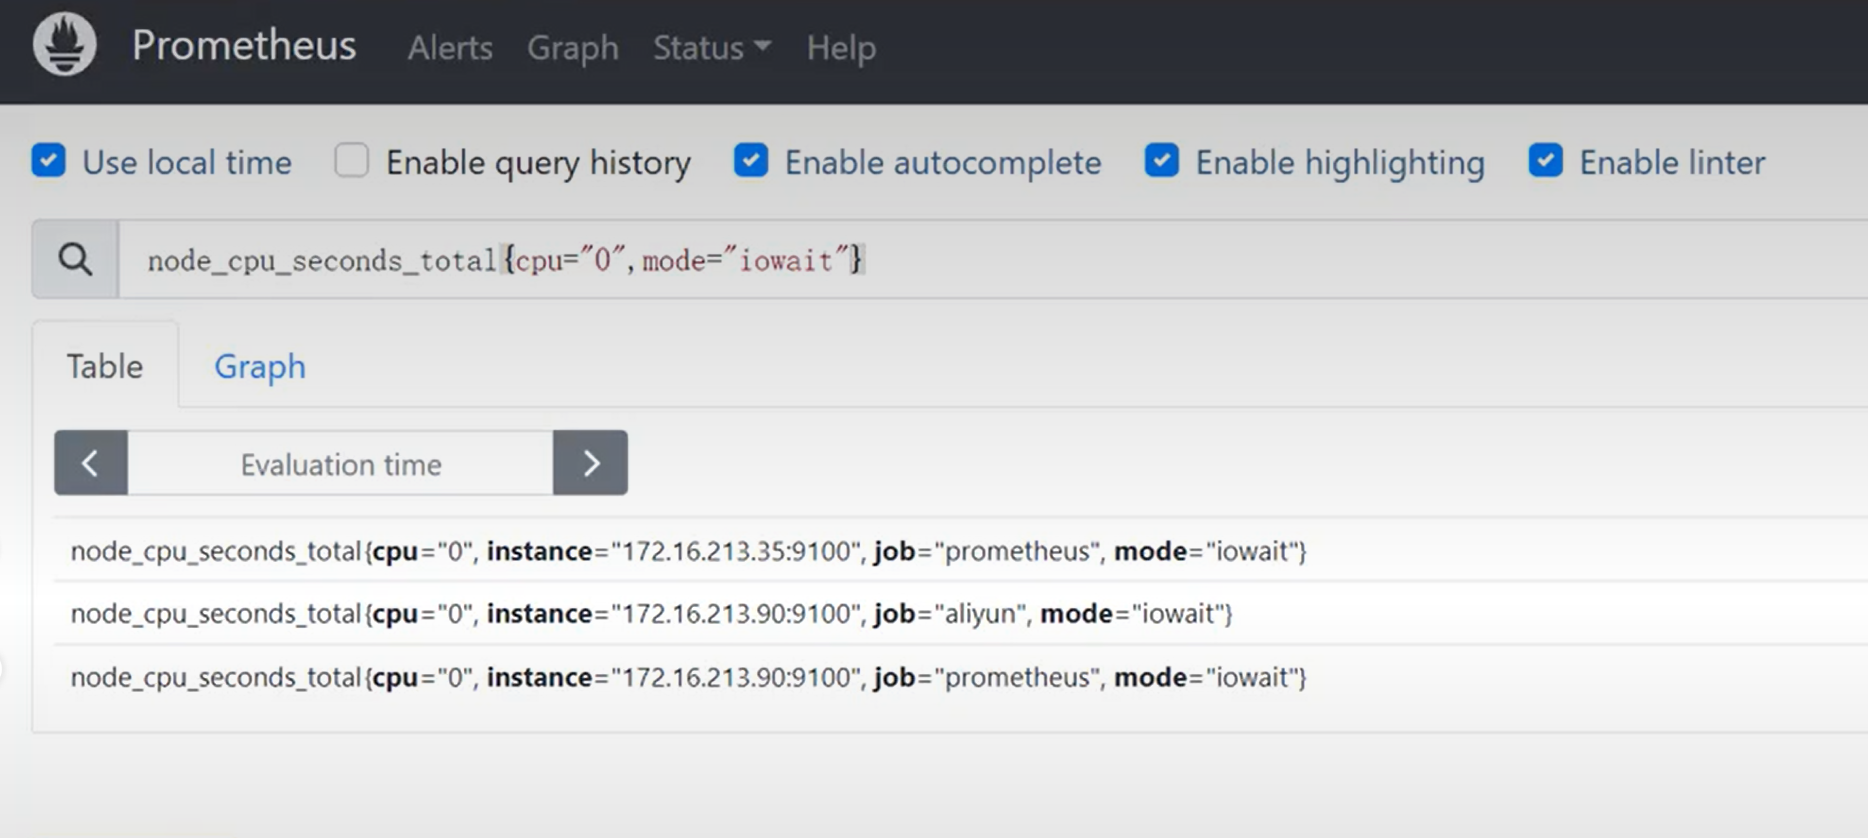
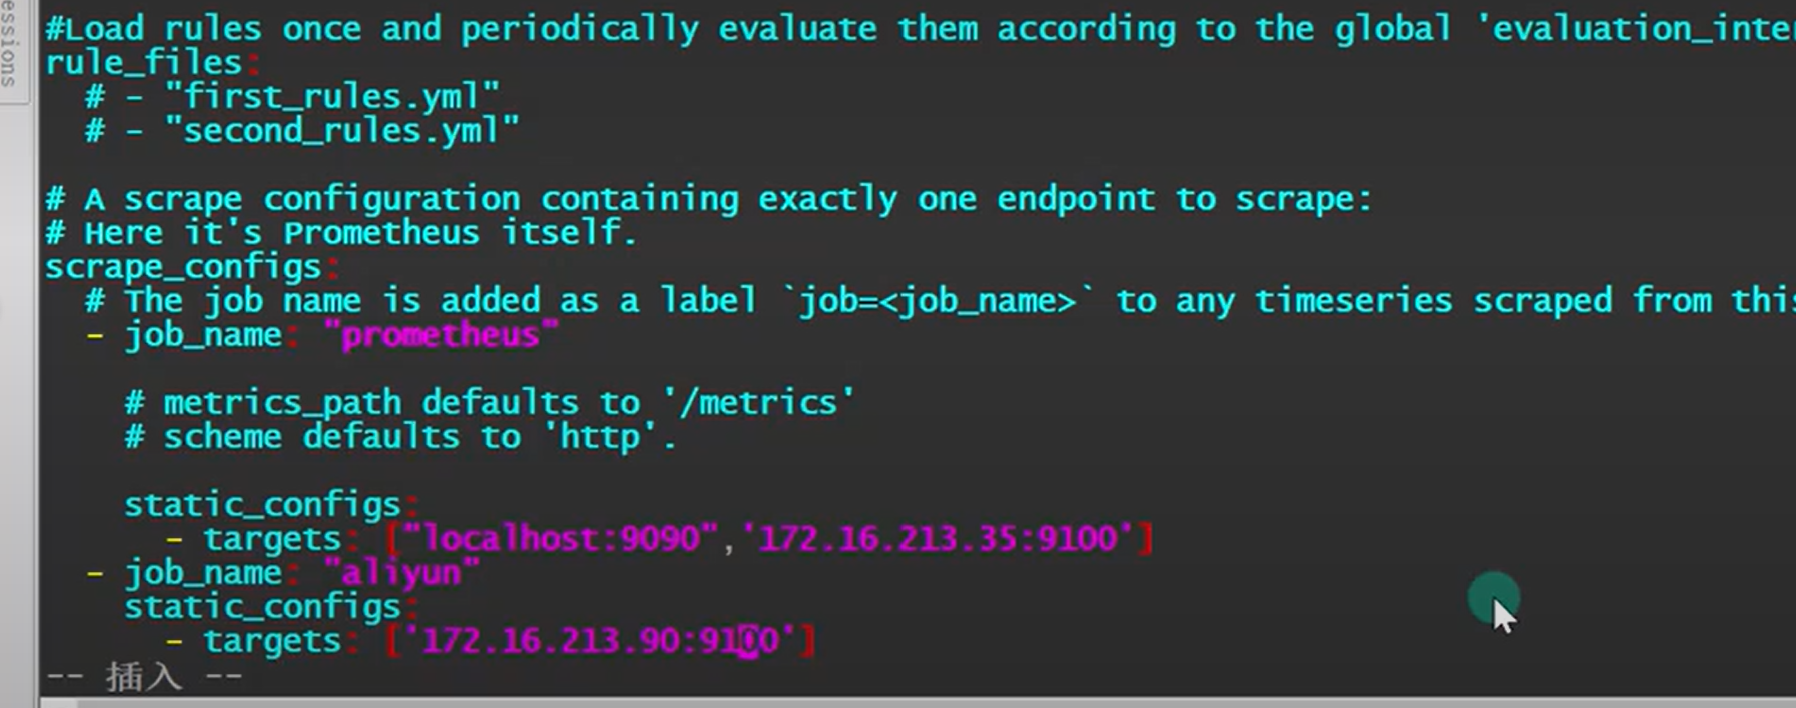
第一个标签指向CPU 0,第二个显示node状态
4.3 执行这个命令启动服务
[root@centos7-1 node_exporter-1.0.1.linux-amd64]# nohup /root/apps/node_exporter-1.0.1.linux-amd64/node_exporter &
[1] 1665
[root@centos7-1 node_exporter-1.0.1.linux-amd64]# nohup: 忽略输入并把输出追加到"nohup.out"
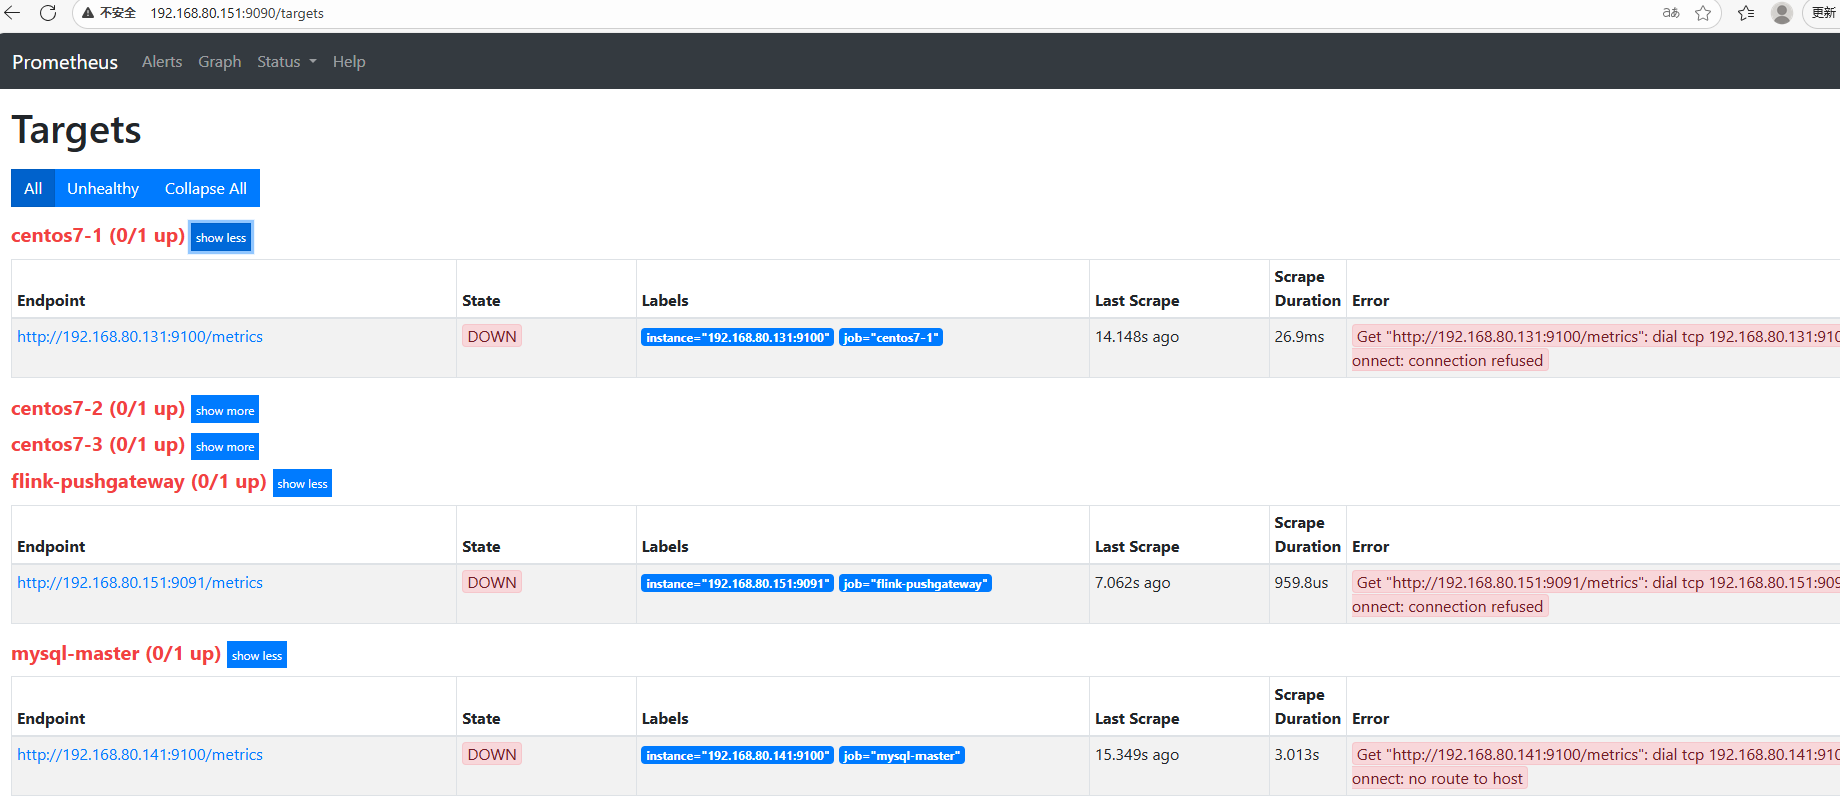
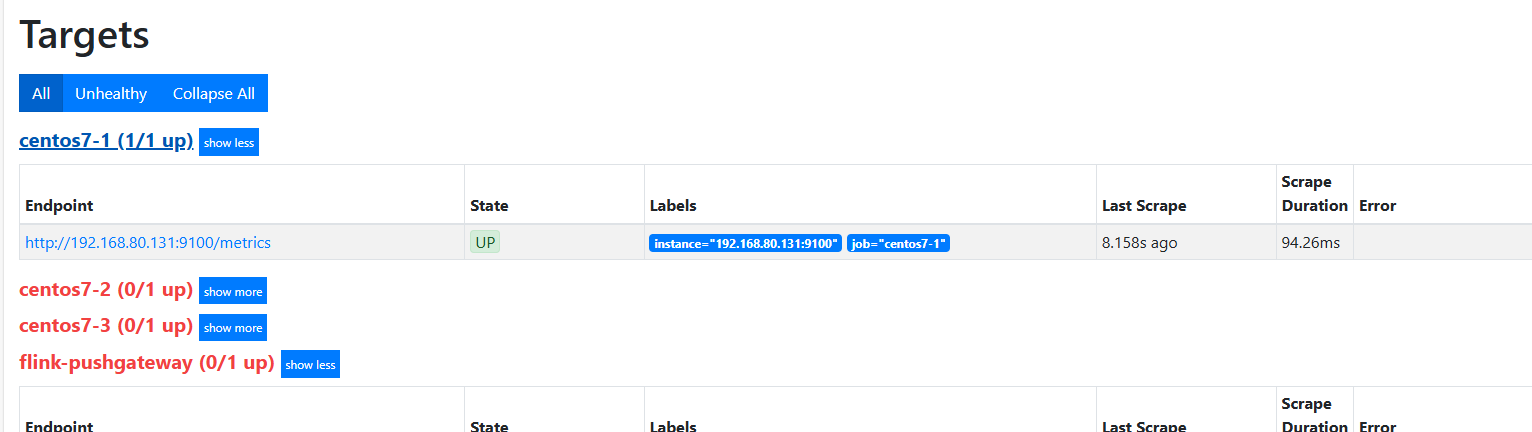
启动刷新发现可以采集信息了
4.4 更详细的信息需要用PQL里面的函数

汇聚全球AI编程工具,助力开发者即刻编程。
更多推荐
 11
11 0
0- 0


 已为社区贡献8条内容

所有评论(0)