
linux中搭建Prometheus和grafana
·
linux中搭建Prometheus和grafana
一、搭建Prometheus
1. 下载
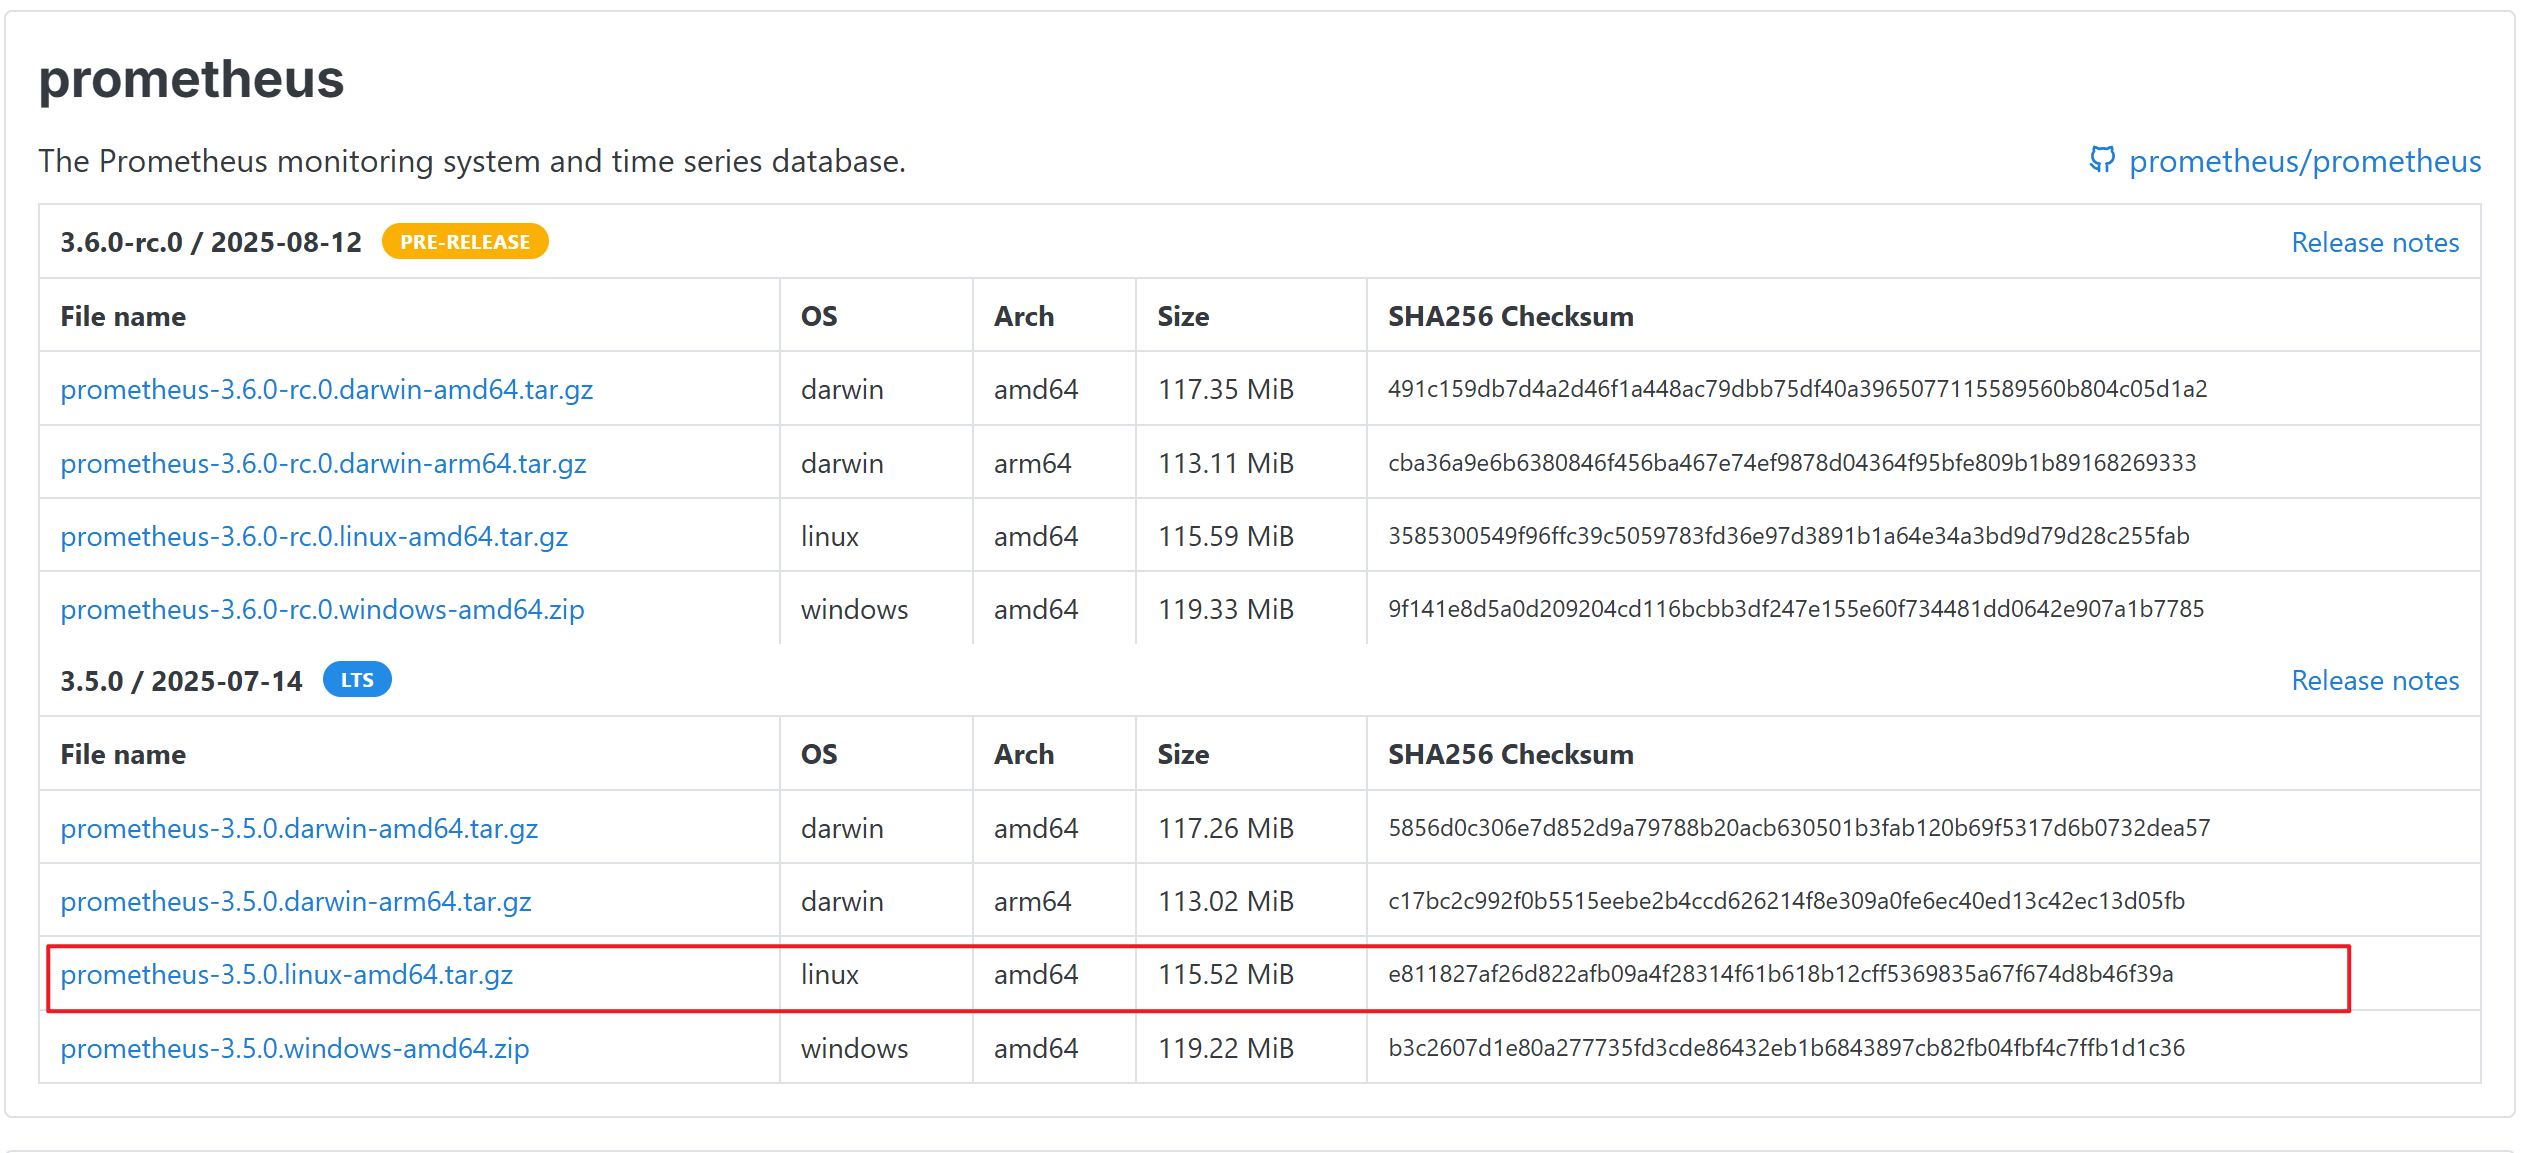
在官网中下载Prometheus压缩包,并上传到服务器
输入以下指令进行解压
tar -zxf prometheus-3.5.0.linux-amd64.tar.gz
# 文件夹重命名
mv prometheus-3.5.0.linux-amd64.tar.gz prometheus-3.5.0
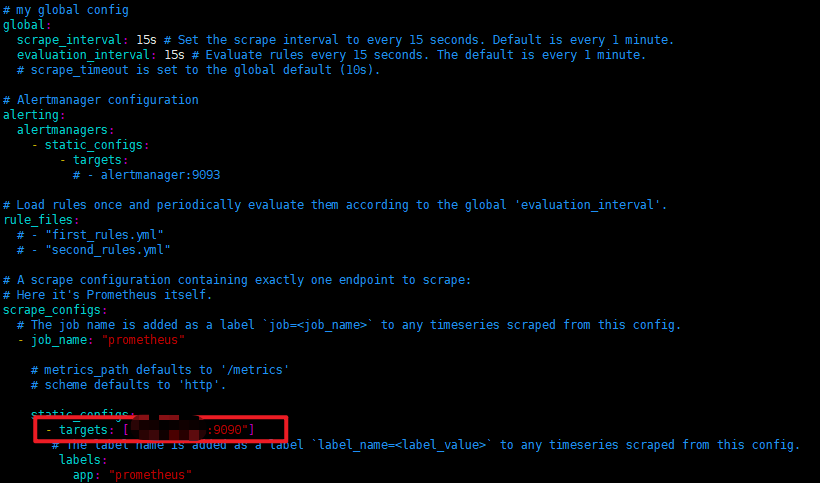
2. 修改配置文件
# my global config
global:
  scrape_interval: 15s # Set the scrape interval to every 15 seconds. Default is every 1 minute.
  evaluation_interval: 15s # Evaluate rules every 15 seconds. The default is every 1 minute.
  # scrape_timeout is set to the global default (10s).

# Alertmanager configuration
alerting:
  alertmanagers:
    - static_configs:
        - targets:
          # - alertmanager:9093

# Load rules once and periodically evaluate them according to the global 'evaluation_interval'.
rule_files:
  # - "first_rules.yml"
  # - "second_rules.yml"

# A scrape configuration containing exactly one endpoint to scrape:
# Here it's Prometheus itself.
scrape_configs:
  # The job name is added as a label `job=<job_name>` to any timeseries scraped from this config.
  - job_name: "prometheus"

    # metrics_path defaults to '/metrics'
    # scheme defaults to 'http'.

    static_configs:
      - targets: ["ip:9090"]
       # The label name is added as a label `label_name=<label_value>` to any timeseries scraped from this config.
        labels:
          app: "prometheus"
3. 创建Prometheus用户并授权
创建Prometheus用于服务启动
groupadd prometheus
useradd -g prometheus -M -s /usr/sbin/nologin prometheus
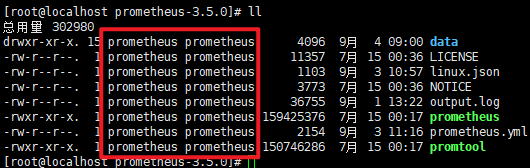
授权
chown -R prometheus:prometheus /Prometheus的保存目录
输入ll查看是否授权成功
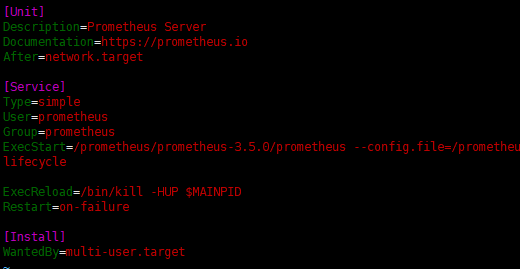
4. 配置服务启动项
# 创建服务文件
vim /usr/lib/systemd/system/prometheus.service
# 配置启动项
[Unit]
Description=Prometheus Server
Documentation=https://prometheus.io
After=network.target

[Service]
Type=simple
User=prometheus
Group=prometheus
ExecStart=/prometheus路径/prometheus --config.file=/prometheus路径/prometheus.yml --storage.tsdb.path=/prometheus路径/data/ --storage.tsdb.retention.time=15d --web.enable-lifecycle

ExecReload=/bin/kill -HUP $MAINPID
Restart=on-failure

[Install]
WantedBy=multi-user.target
5. 启动服务
systemctl daemon-reload
systemctl start prometheus.service
systemctl enable prometheus.service # 开启自启服务
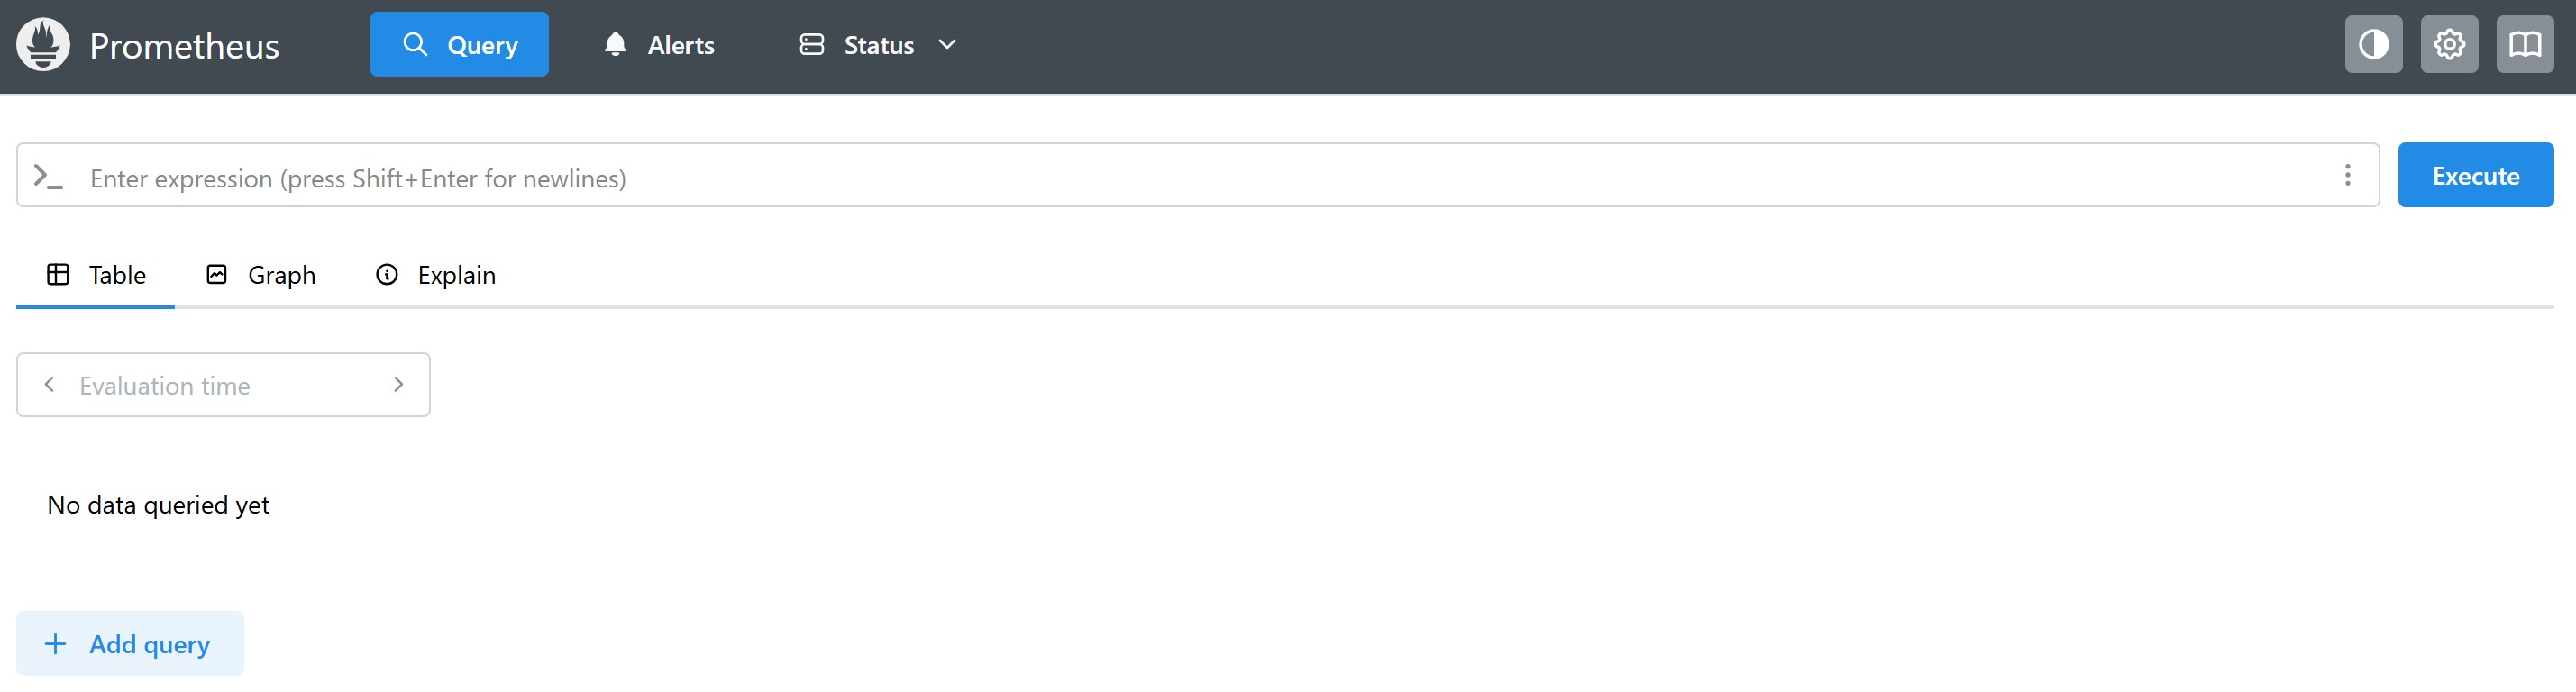
6. 查看Prometheus界面
端口号默认9090
二、部署node_exporter
1. 下载
在官网中下载node_exporter压缩包,并上传服务器
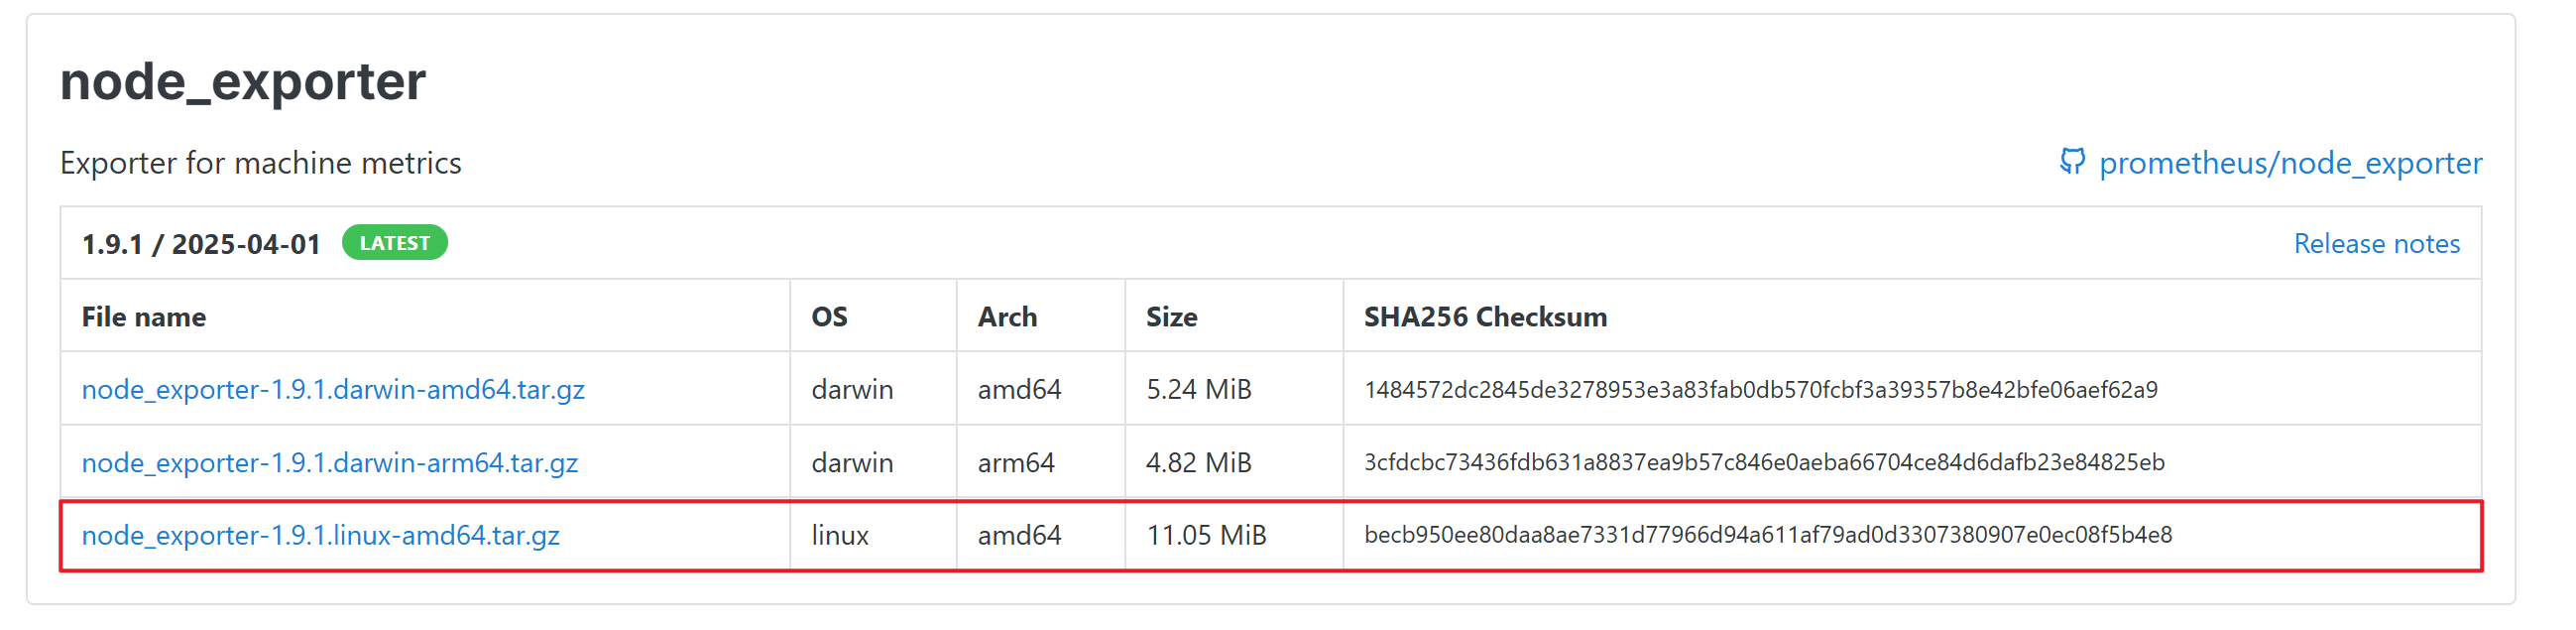
解压并修改名称
tar -zxf node_exporter-1.9.1.linux-amd64.tar.gz
mv node_exporter-1.9.1.linux-amd64.tar.gz node_exporter-1.9.1
2. 授权
chown -R prometheus:prometheus /node_exporter的保存目录
3. 配置服务器启动项
vim /usr/lib/systemd/system/node_exporter.service
# 文件内容
[Unit]
Description=node_exporter
After=network.target

[Service]
Type=simple
User=prometheus
Group=prometheus
Restart=on-failure
ExecStart=/node文件路径/node_exporter-1.9.1/node_exporter --web.listen-address=0.0.0.0:9100

[Install]
WantedBy=multi-user.target
4. 启动服务
systemctl daemon-reload
systemctl start node_exporter.service
systemctl enable node_exporter.service # 开启自启服务
5. 修改Prometheus配置文件
如有多台服务器需要监控可先创建一个json文件,将多台服务器配置在json文件中
vim linux.json
# linux.json
[
        {
                "targets": ["ip:9100"],
                "labels": {
                        "instance": "服务器1"
                }
        },
        {
                "targets": ["ip:9100"],
                "labels": {
                        "instance": "服务器2"
                }
        }
]
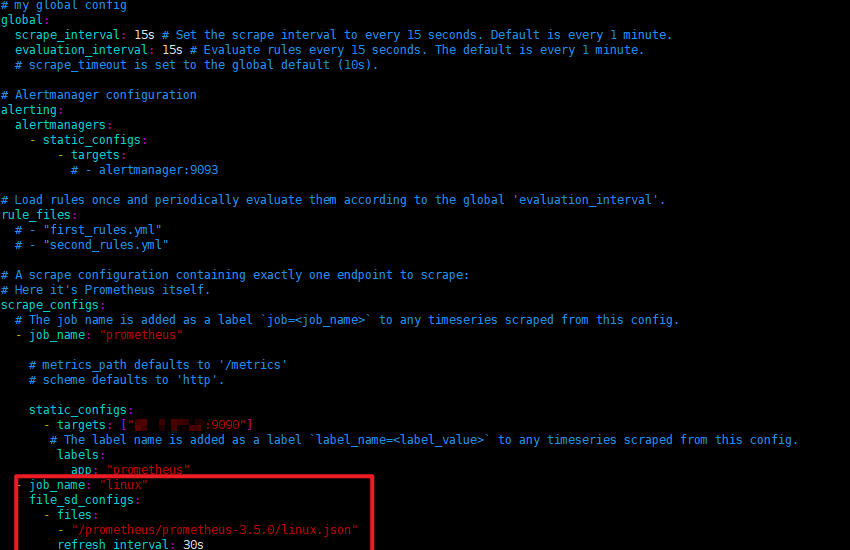
修改prometheus.yml文件,添加以下内容
  - job_name: "linux"
    file_sd_configs:
      - files:
        - "/json文件路径/linux.json"
        refresh_interval: 30s
6. 重启Prometheus服务
systemctl restart prometheus
打开Prometheus页面,点击status > target health就可以看到当前节点了

三、搭建grafana
1. 下载
进入官网下载grafana压缩包,并上传服务器
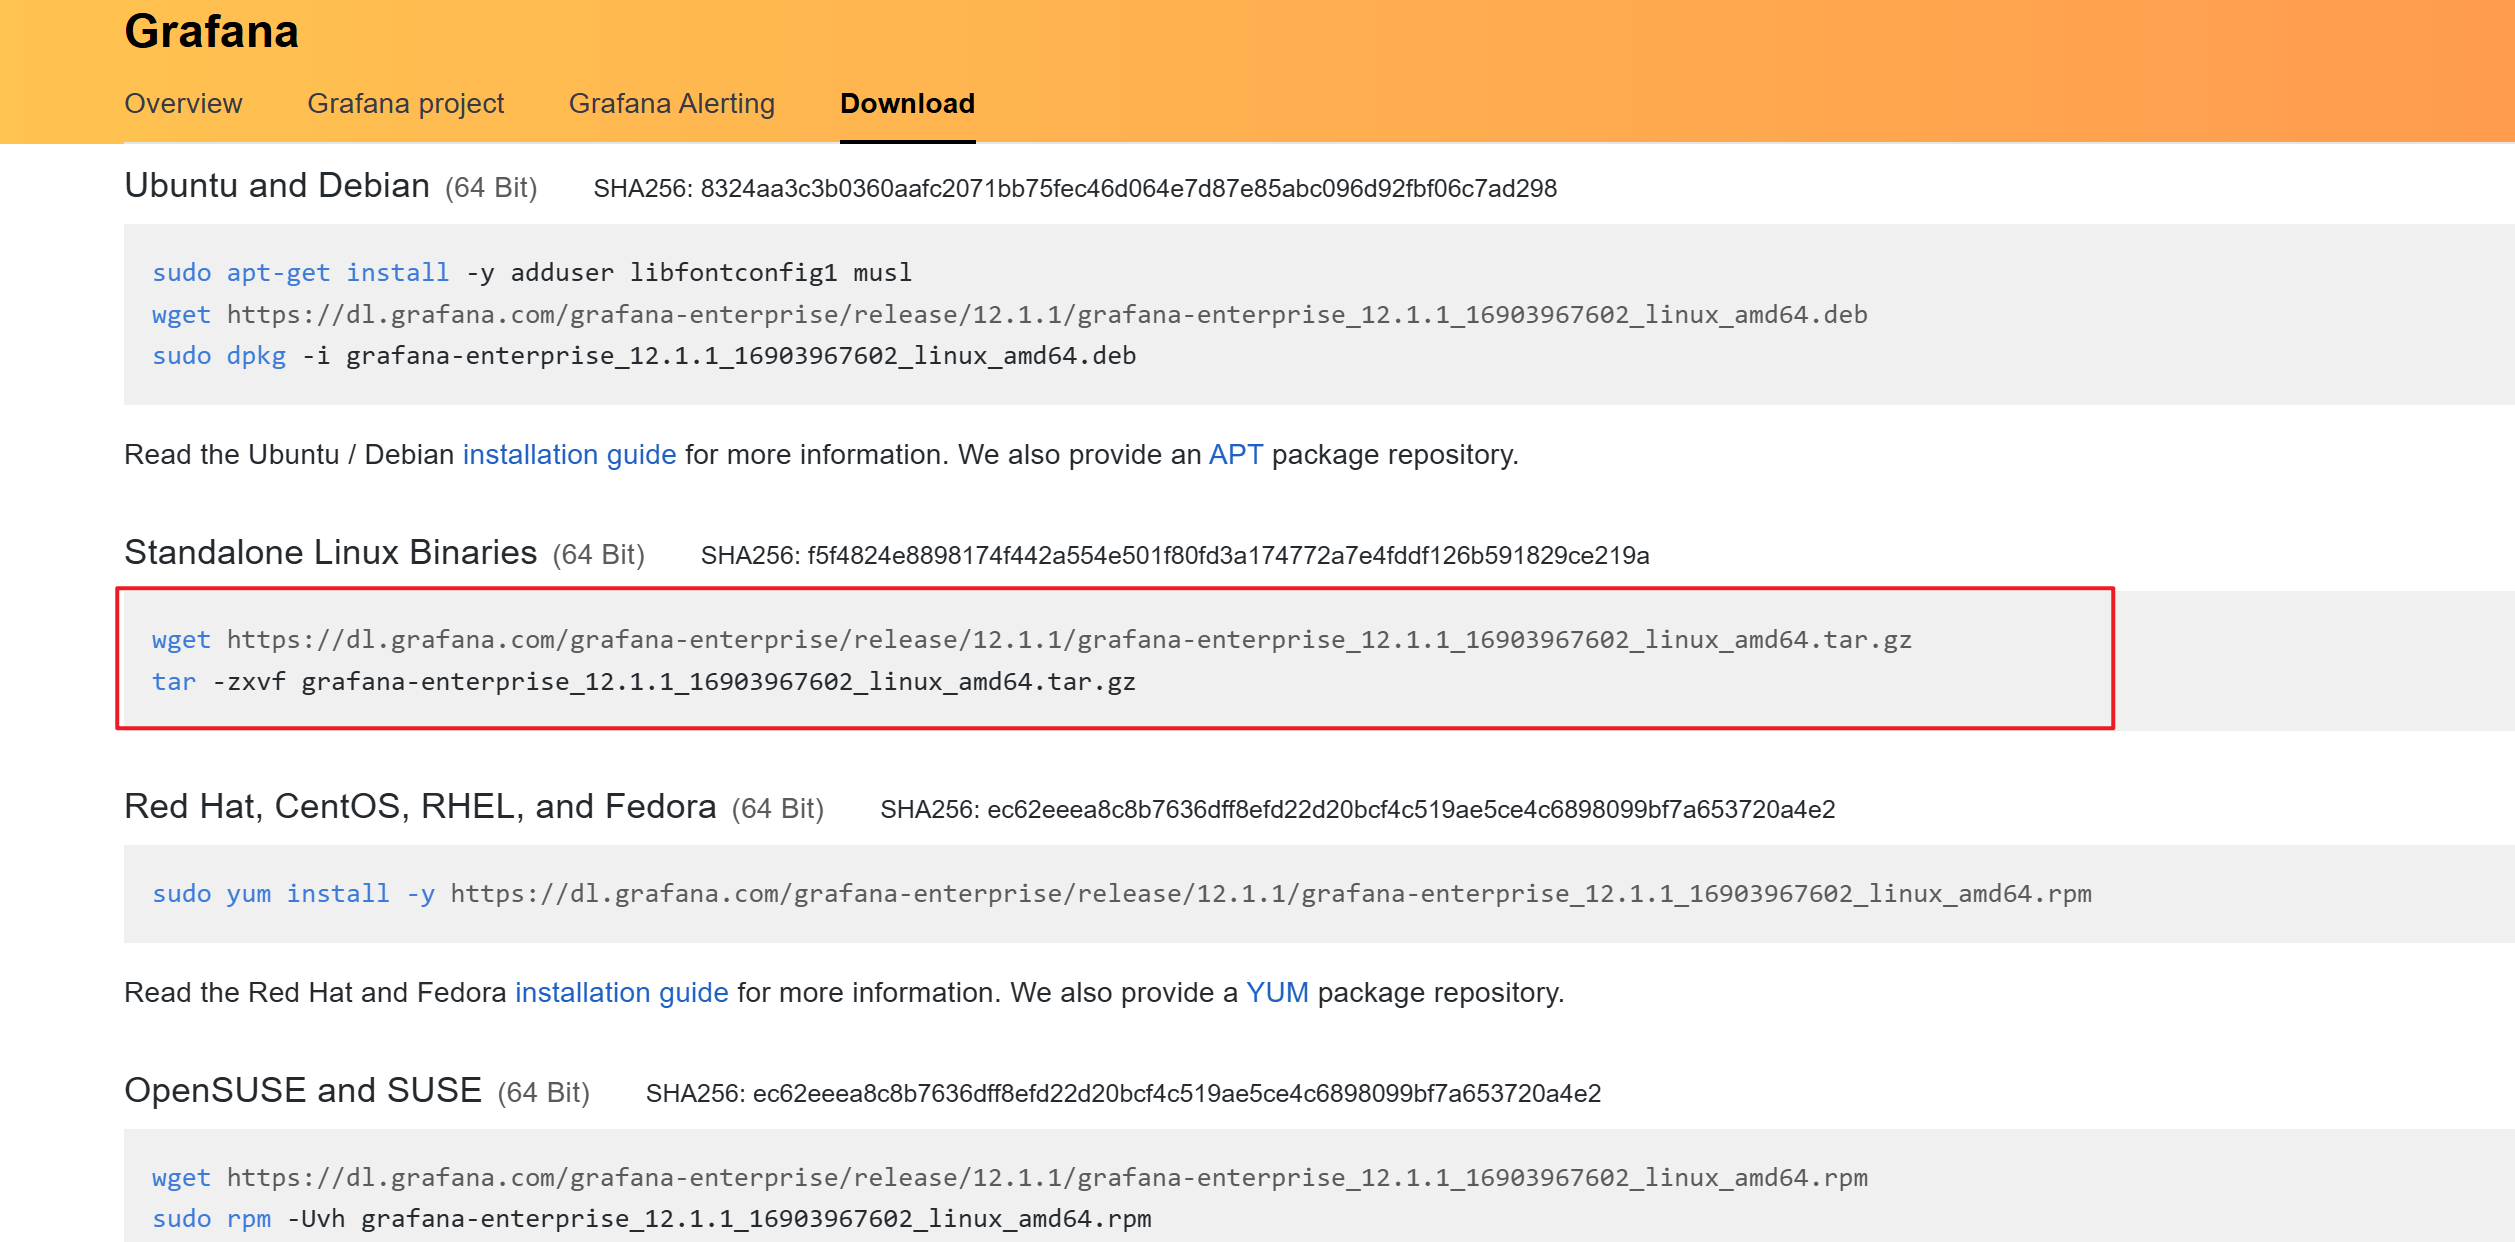
可以点击红框中的连接直接下载压缩包
将压缩包上传到服务器,输入以下指令进行解压
tar -zxvf grafana-enterprise_12.1.1_16903967602_linux_amd64.tar.gz
# 重命名文件夹
mv grafana-enterprise_12.1.1_16903967602_linux_amd64.tar.gz grafana
2. 授权
chown -R prometheus:prometheus /grafana的保存目录
3. 配置服务启动项
vim /usr/lib/systemd/system/grafana-server.service

#grafana-server.service
[Unit]
Description=Grafana server
After=network.target

[Service]
Type=simple
User=prometheus
Group=prometheus
Restart=on-failure
ExecStart=/prometheus/grafana/bin/grafana-server --config=/prometheus/grafana/conf/defaults.ini --homepath=/prometheus/grafana

[Install]
WantedBy=multi-user.target
4. 启动服务
systemctl daemon-reload
systemctl start grafana-server.service
systemctl enable grafana-server.service
端口号默认3000 初始账号密码都是admin

5. grafana配置Prometheus
1)新建数据源
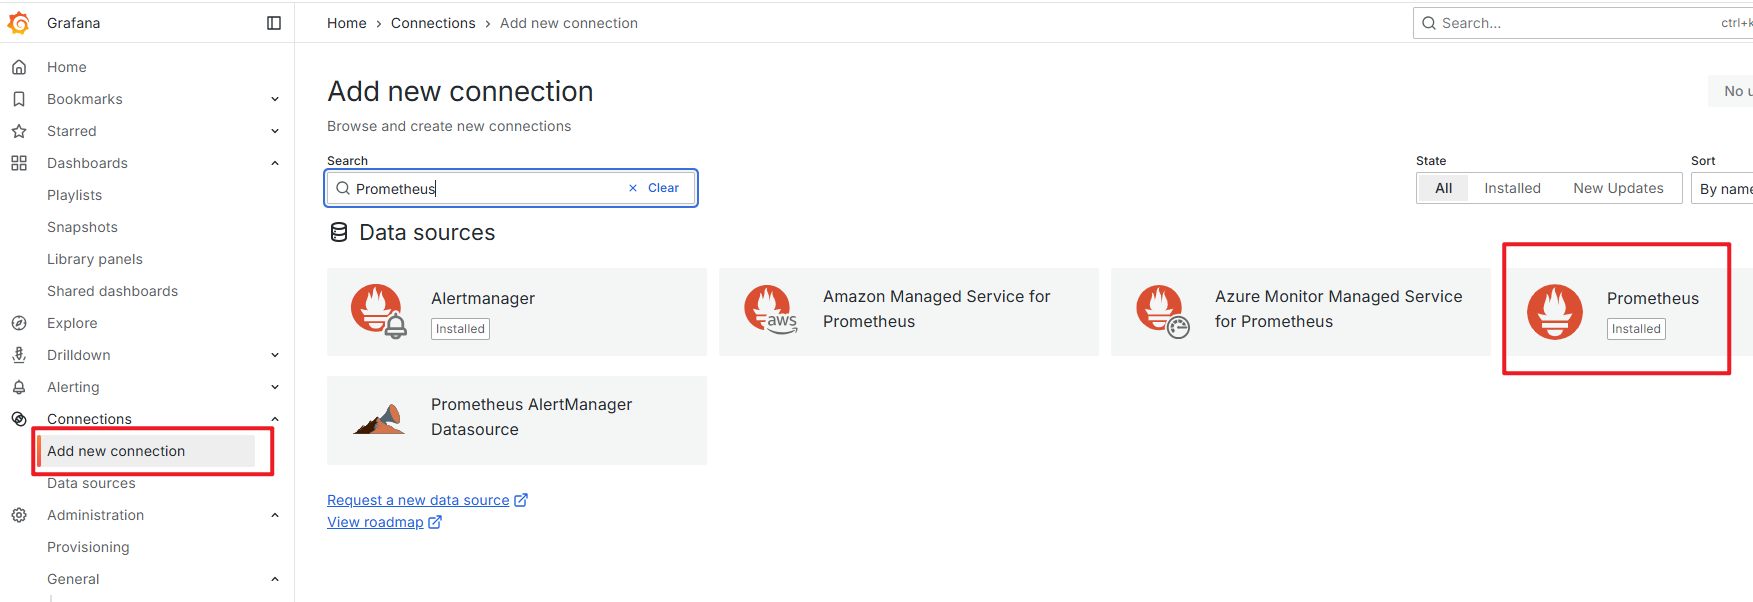
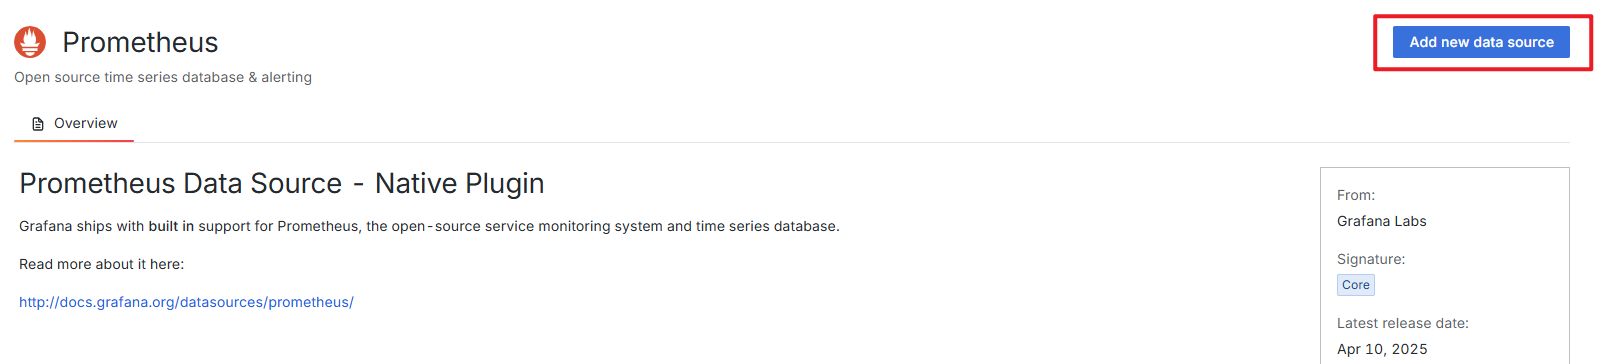
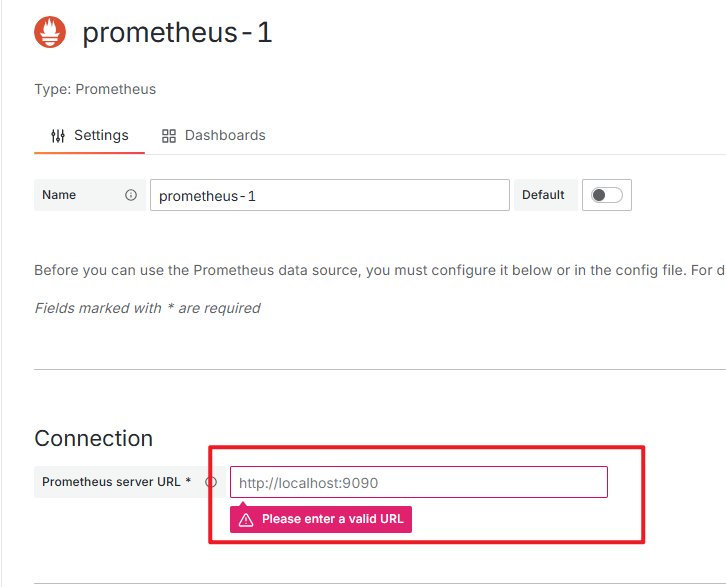
输入Prometheus地址,拉到最下面点击Save & test
2)选择展示模板
可以在grafana社区挑选对应的展示模板
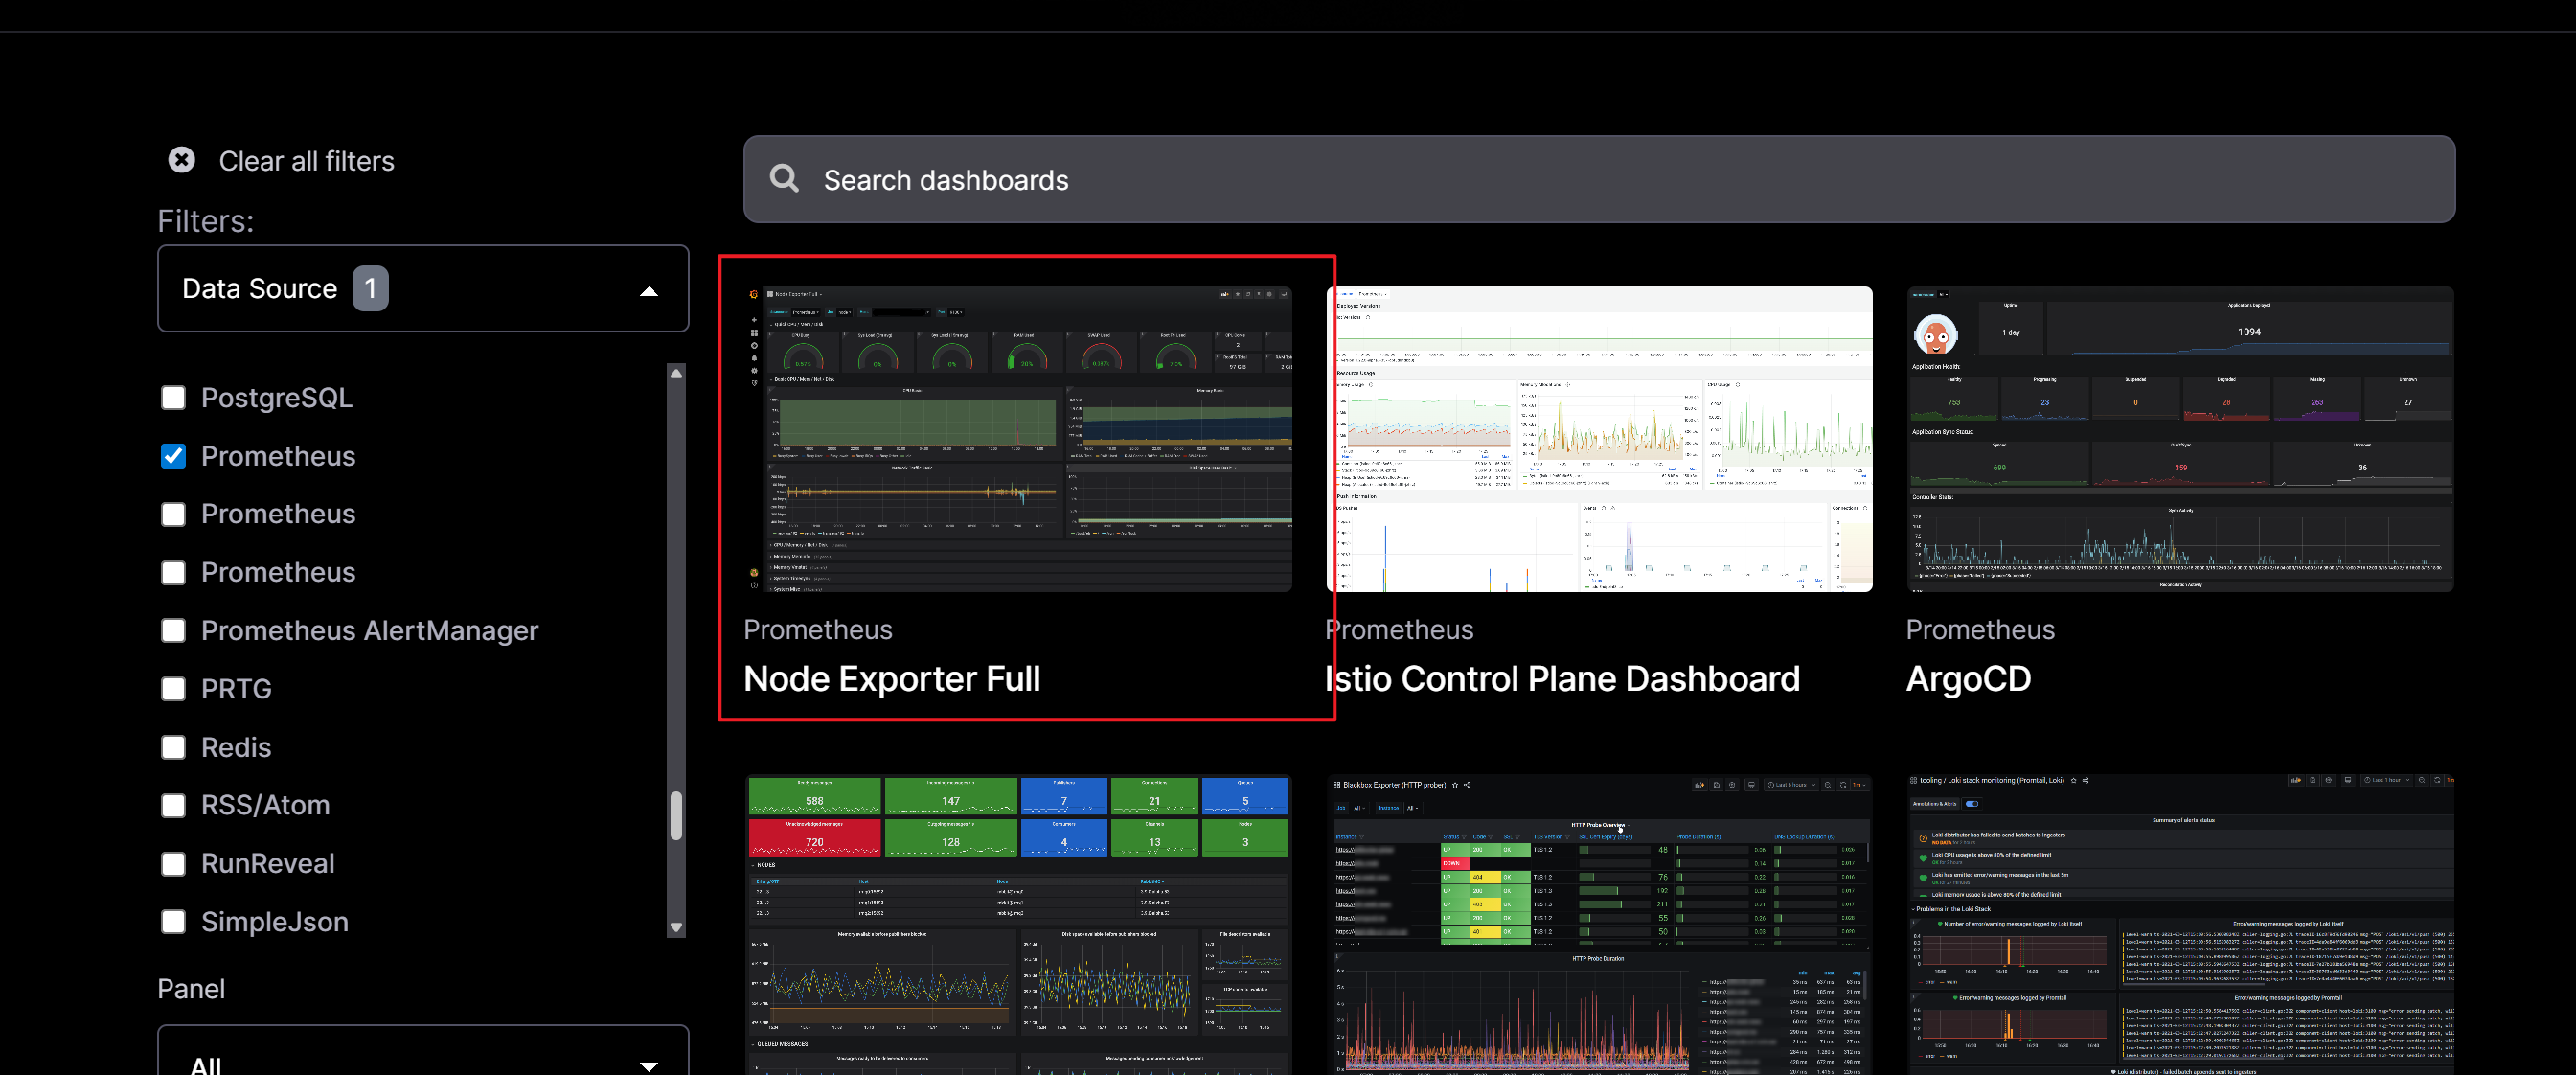
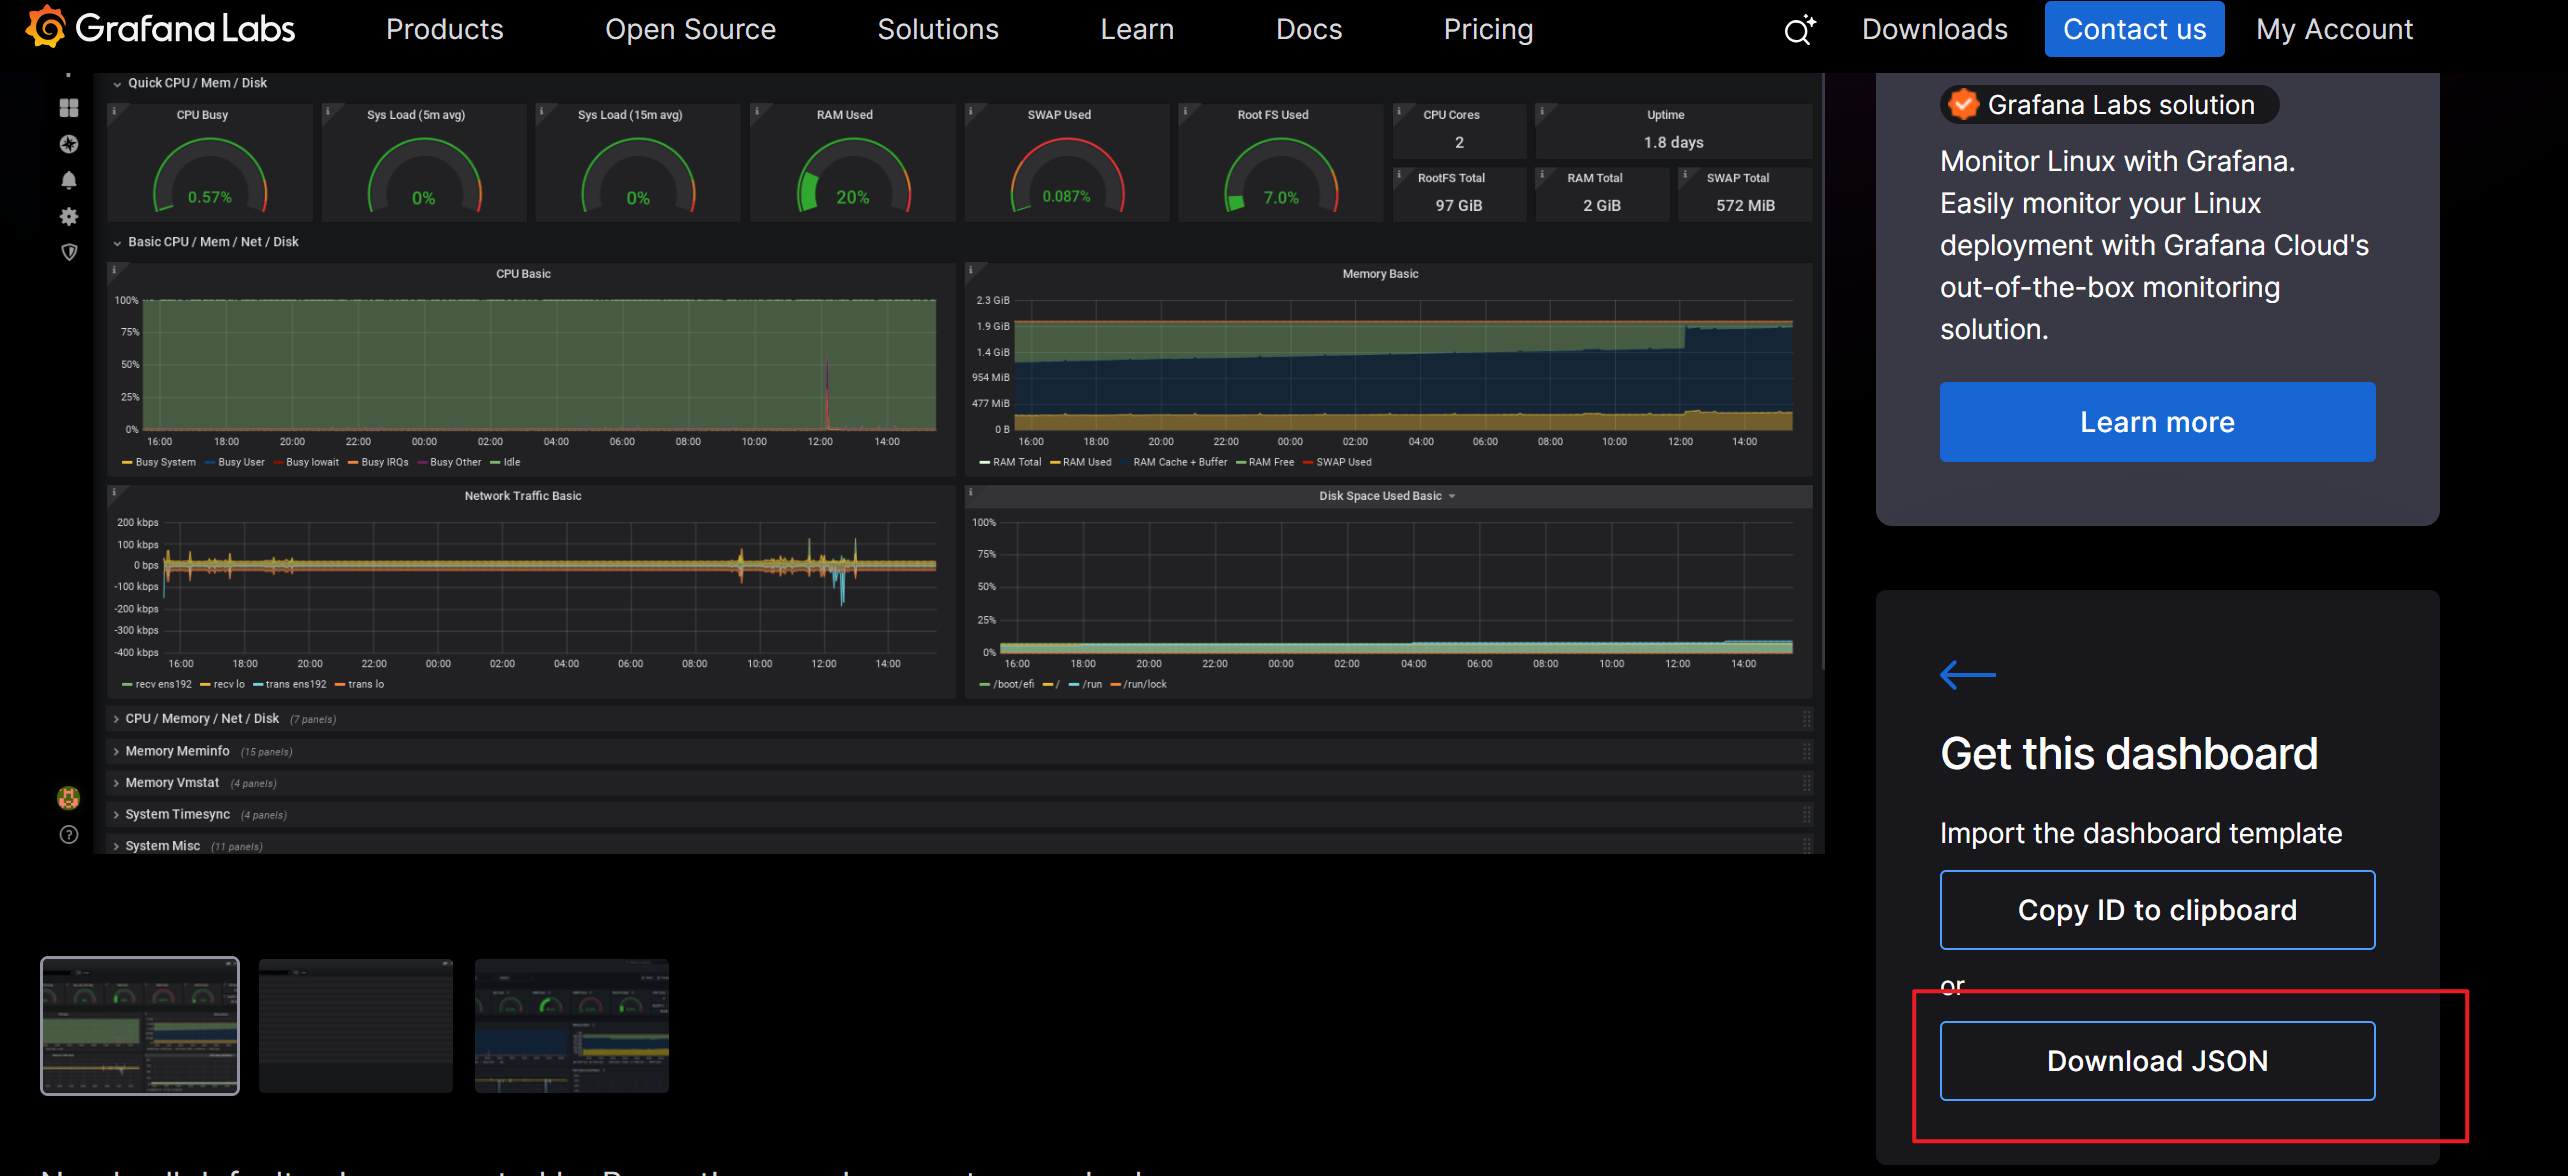
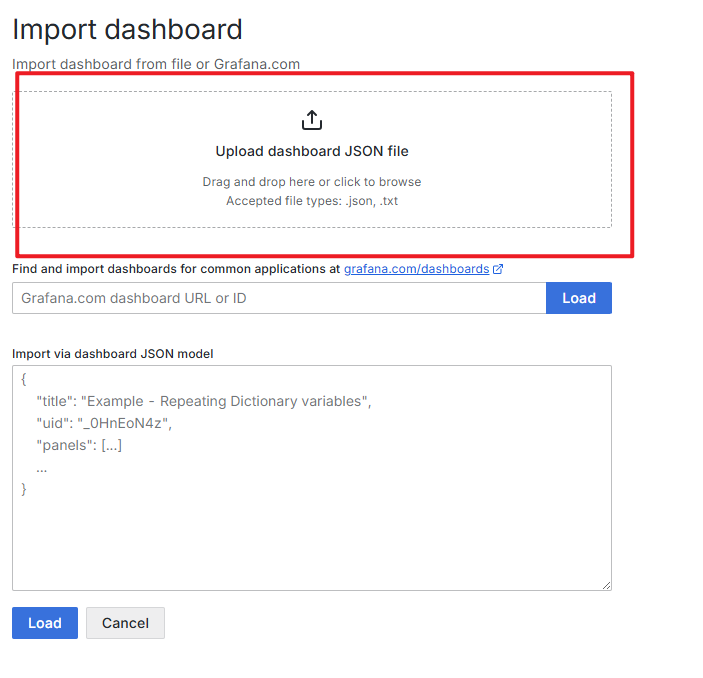
3)导入模板

上传json文件
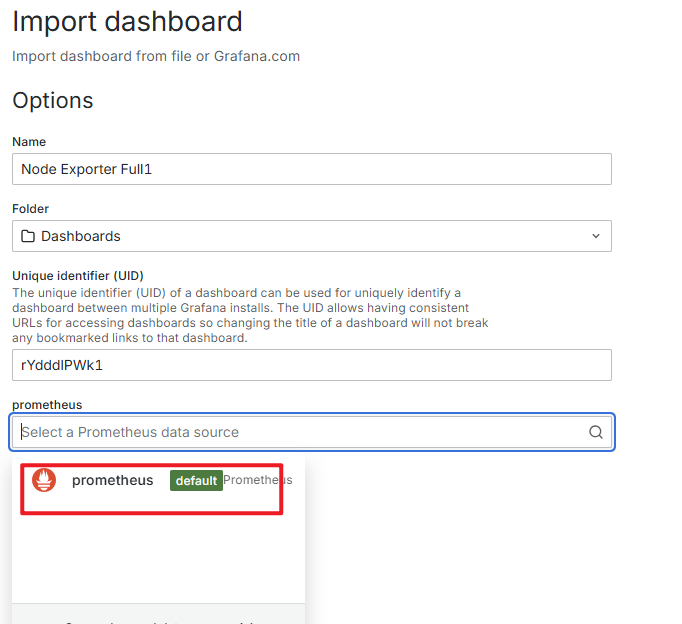
选择数据源

点进去就可以查看服务型相关数据啦
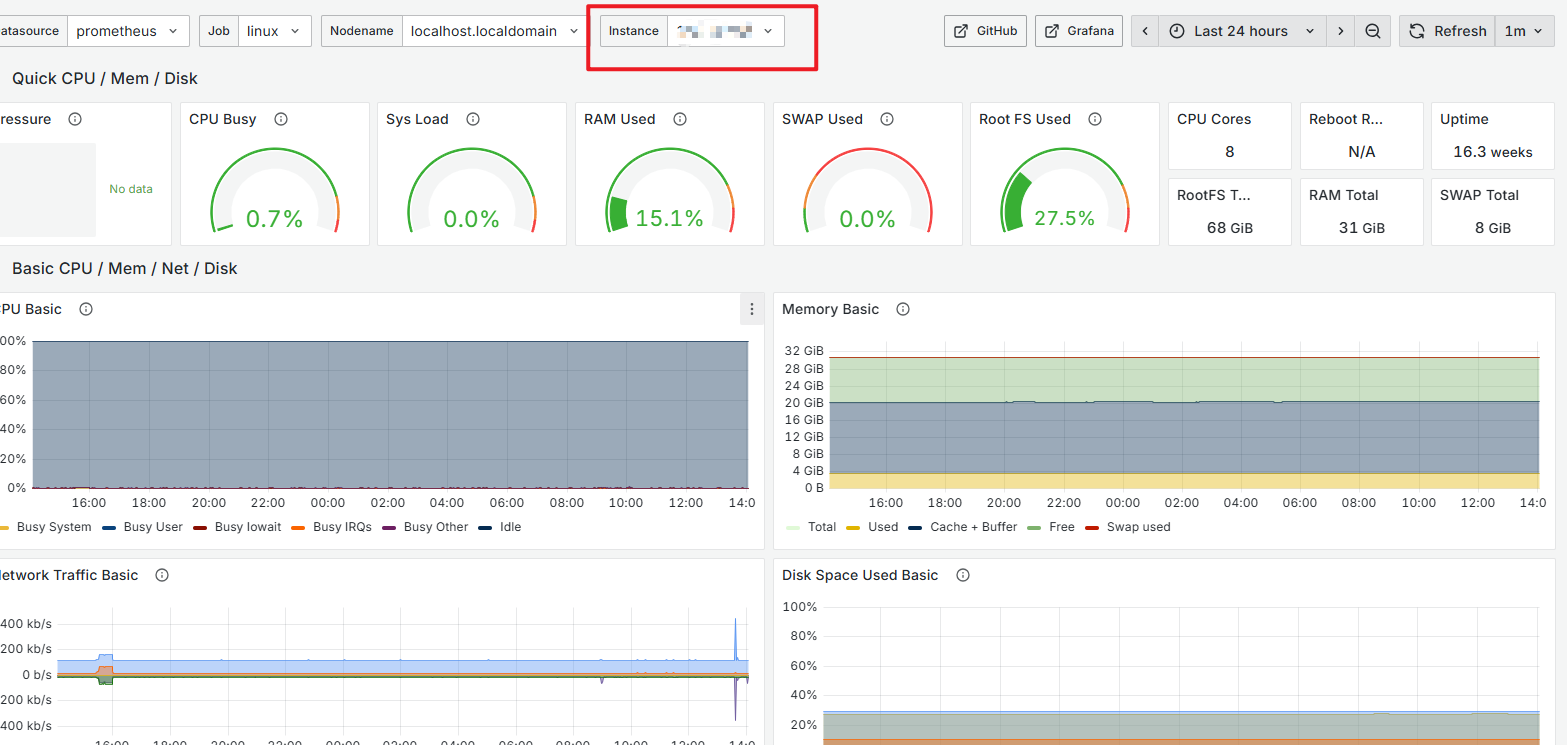
这里可以切换多个实例
四、问题
1. 服务启动不起来
问题描述:输入systemctl status 服务名,发现服务启动失败
排查逻辑:输入journalctl -xe | grep 服务名,查看报错日志
systemctl status prometheus.service
journalctl -xe |grep prometheus
- 日志截图

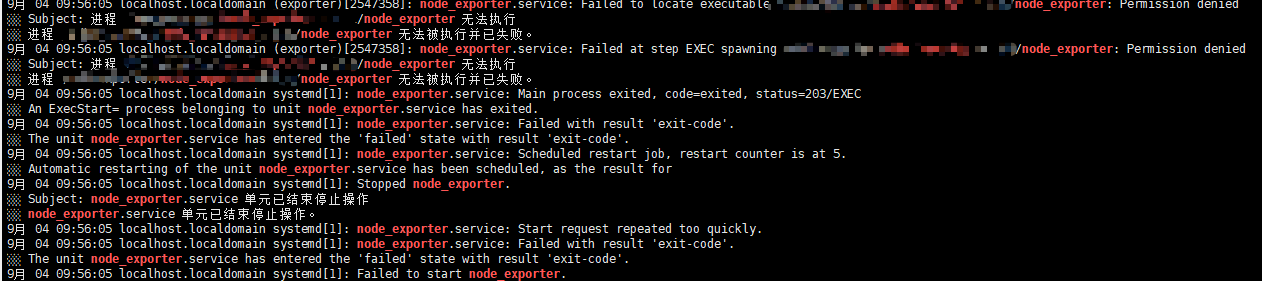
解决方法:请检查是否创建Prometheus角色,参考上述创建角色并授权 - 日志截图

解决方法:执行以下指令
semanage fcontext -a -t bin_t '/prometheus保存目录/prometheus'
restorecon -v 'prometheus'

2. 网页打不开
问题描述:输入ip+端口,显示无法访问
解决方法:检查防火墙端口是否开放
firewall-cmd --query-port=端口号/tcp #查询端口号是否开放
firewall-cmd --add-port=端口号/tcp --permanent #开放端口号
firewall-cmd --permanent --remove-port=端口号/tcp #移除端口号
firewall-cmd --reload
3. 节点显示down

解决办法:同上,检查服务器端口是否开放

汇聚全球AI编程工具,助力开发者即刻编程。
更多推荐

 21
21 0
0- 0


 已为社区贡献1条内容

所有评论(0)