
Copernicus EMC-BUILT全球地表数据集
今日分享:
Copernicus EMC-BUILT全球地表数据集
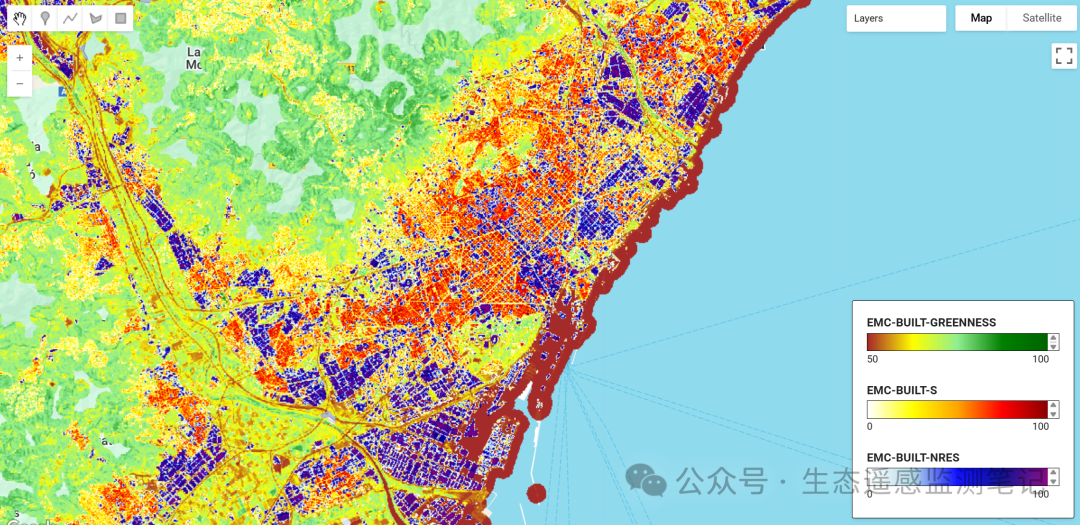
哥白尼计划(EMC)建成区产品(EMC-BUILT R2025A)提供2022年参考年份的高分辨率全球建成区地表、非住宅建筑和植被分布数据。该数据集是哥白尼计划首个基于Sentinel-2数据和深度学习架构的建成区数据产品,该数据集由欧盟委员会联合研究中心(JRC)作为哥白尼应急管理服务(CEMS)的一部分制作,旨在支持危机管理、灾害风险降低、城市规划和可持续发展监测。
该数据集采用改进的 U-Net 卷积神经网络 (CNN),该网络基于 Sentinel-2 影像进行训练,并结合了全面的地理空间协变量,包括光谱指标、时间谐波以及来自多个开源数据源(OpenStreetMap、Microsoft Building Footprints、Google Open Buildings)的建筑物轮廓数据。该数据集提供三种核心产品,空间分辨率分别为: 10 米、100 米和 1000 米,以及 WGS84 坐标系下的 3/30 弧秒:建成区总面积、非住宅建成区面积以及建成区内的绿化率。所有产品均遵循开放且免费的数据访问政策,符合哥白尼计划的原则。
数据集制作方法:
EMC-BUILT 生产工作流程包括六个主要步骤:
-
数据预处理:计算2022年所有Sentinel-2 Level-1C影像的光谱和时间指标,包括谐波系数和百分位合成图。参考数据收集:汇集来自多个开放数据源(OSM、微软、谷歌)的全球建筑占地面积数据
-
模型训练:开发改进的 U-Net CNN模型,用于将 Sentinel-2 指标映射到建成区表面
-
预测:将训练好的模型应用于所有 Sentinel-2 数据块,并进行集成预测
-
后处理:集合平均、使用辅助指数(NDWI)进行误差校正
-
镶嵌和重投影:在 WGS84 坐标系中进行重投影到全球网格
-
植被信息层由NDVI指数中值导出,并在建成区周围设置 300 米缓冲区,以捕捉居民区及其周围的植被。
数据集特征:
| 范围 | 价值 |
|---|---|
| 空间分辨率 | 10米、100米、1000米 |
| 时间覆盖范围 | 2022年 |
| 地理覆盖范围 | 全球陆地面积(纬度 -60.9° 至 89.1°) |
| 坐标系 | 世界 Mollweide (ESRI:54009), WGS84 (EPSG:4326) |
| 数据格式 | 云优化 GeoTIFF (COG) |
| 源数据 | Sentinel-2 1C级影像 |
| 方法论 | U-Net CNN 与随机森林 dasymetric 方法 |
| 更新频率 | 每两年一次 |
EMC -BUILT数据集提供了三个互补的数据集:
| 资产名称 | 描述 | 值范围 | 单位 |
|---|---|---|---|
EMC-BUILT-S |
每个网格单元的总建筑面积 | 0-100(10米),0-10,000(100米),0-1,000,000(1000米) | 平方米 |
EMC-BUILT-NRES |
非住宅建筑面积(工业/商业) | 0-100(10米),0-10,000(100米),0-1,000,000(1000米) | 平方米 |
EMC-BUILT-GREENNESS |
建成区内及周围的植被覆盖度(NDVI) | 0-100 | NDVI百分比 |
引用方式:
数据集:
Riffler, M., Leitner, A., Ralser, S., Poglitsch, E., Schleicher, C., Faucqueur, L., Pennec, A., Marconcini, M., Esch, T., Julea, A.M., Kemper, T., Politis, P., Melchiorri, M. (2025): EMC-BUILT R2025A – Exposure Mapping Component built-up surface grid, derived from Sentinel-2 year 2022. European Commission, Joint Research Centre (JRC) [Dataset]
doi: 10.2905/4cd8ccee-bfd1-48c5-9047-61c0343c41e9
论文:
Kemper, T., Politis, P., Mari Rivero, I., Riffler, M., Leitner, A. et al. (2025): Copernicus Exposure Mapping Component Built-up product 2022 - EMC-BUILT R2025,
Publications Office of the European Union, Luxembourg, JRC144315
GEE调用链接:
// Load the three EMC-BUILT products
var builtUpSurface = ee.ImageCollection("projects/earthengine-legacy/assets/projects/sat-io/open-datasets/ESA/CEMS/EMC-BUILT-S");
var nonResidential = ee.ImageCollection("projects/earthengine-legacy/assets/projects/sat-io/open-datasets/ESA/CEMS/EMC-BUILT-NRES");
var greenness = ee.ImageCollection("projects/earthengine-legacy/assets/projects/sat-io/open-datasets/ESA/CEMS/EMC-BUILT-GREENNESS");
01
—
GEE部分实现代码
//Shuffle the image collection to fetch random data
// Load the three EMC-BUILT products
var builtUpSurface = ee.ImageCollection("projects/earthengine-legacy/assets/projects/sat-io/open-datasets/ESA/CEMS/EMC-BUILT-S");
var nonResidential = ee.ImageCollection("projects/earthengine-legacy/assets/projects/sat-io/open-datasets/ESA/CEMS/EMC-BUILT-NRES");
var greenness = ee.ImageCollection("projects/earthengine-legacy/assets/projects/sat-io/open-datasets/ESA/CEMS/EMC-BUILT-GREENNESS");

// Get the mosaic image from each collection
var builtUp = builtUpSurface.mosaic();
var nres = nonResidential.mosaic();
var green = greenness.mosaic();

// Center on Barcelona, Spain
Map.setCenter(117.9278,37.47, 12);
Export.image.toDrive({
  image: builtUp.clip(roi),//选择导出影像的波段
  description: 'builtUp',//选择导出云盘的文件夹名称
  crs: "EPSG:4326",//坐标系
  scale: 100,//空间分辨率
  region: roi,//研究区
  maxPixels: 1e13,//最大像元个数
  folder: 'builtUp'
});

// Visualization parameters
var builtUpVis = {
  min: 0,
  max: 100,
  palette: ['white', 'yellow', 'orange', 'red', 'darkred']
};

var nresVis = {
  min: 0,
  max: 100,
  palette: ['white', 'lightblue', 'blue', 'darkblue', 'purple']
};

var greennessVis = {
  min: 50,
  max: 100,
  palette: ['brown', 'yellow', 'lightgreen', 'green', 'darkgreen']
};

// Add layers to map
Map.addLayer(green.mask(green.neq(0)), greennessVis, '绿度(NDVI%)');
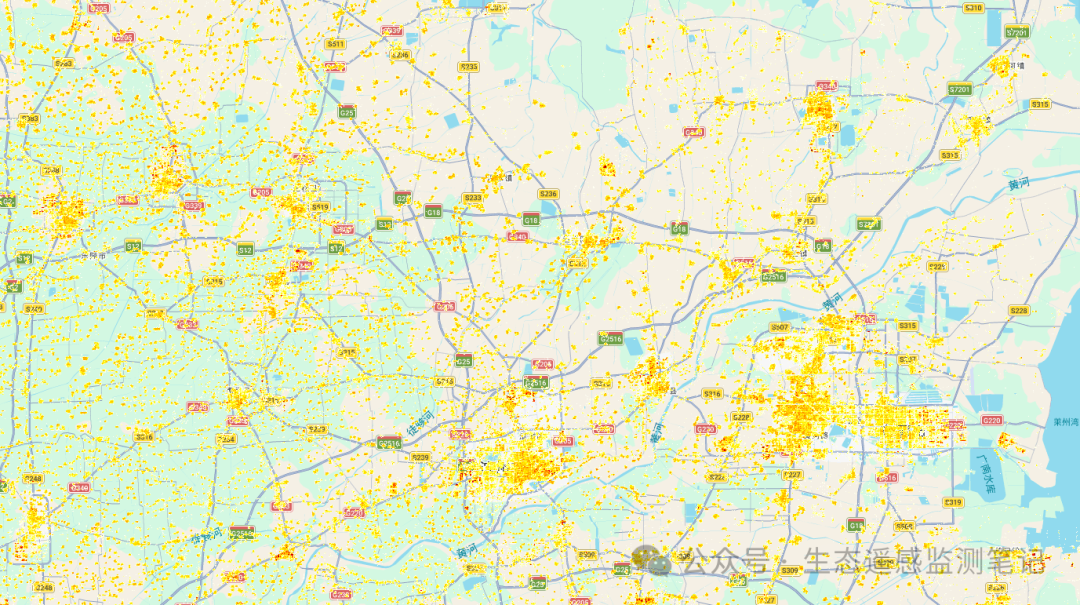
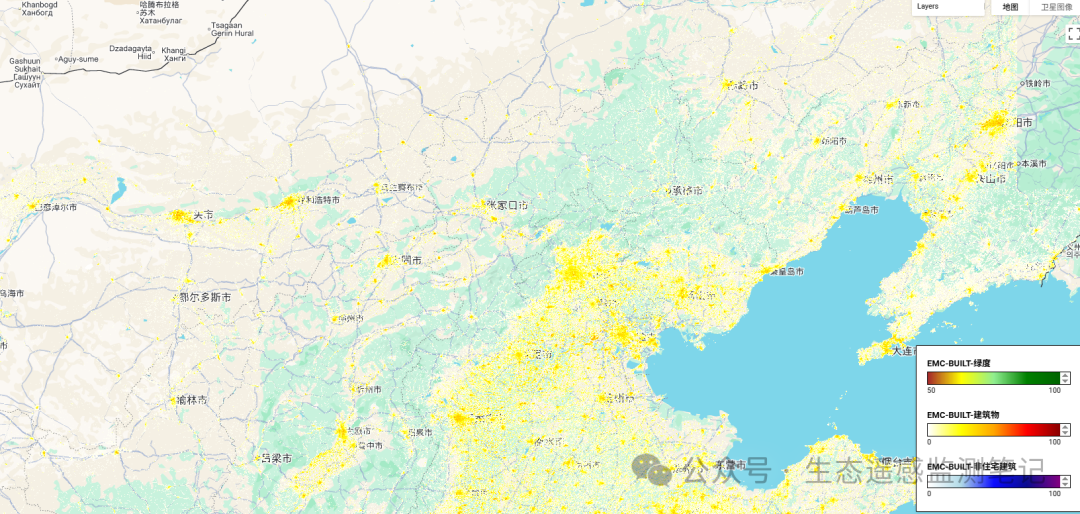
Map.addLayer(builtUp.mask(builtUp.neq(0)), builtUpVis, '建筑面积(平方米)');
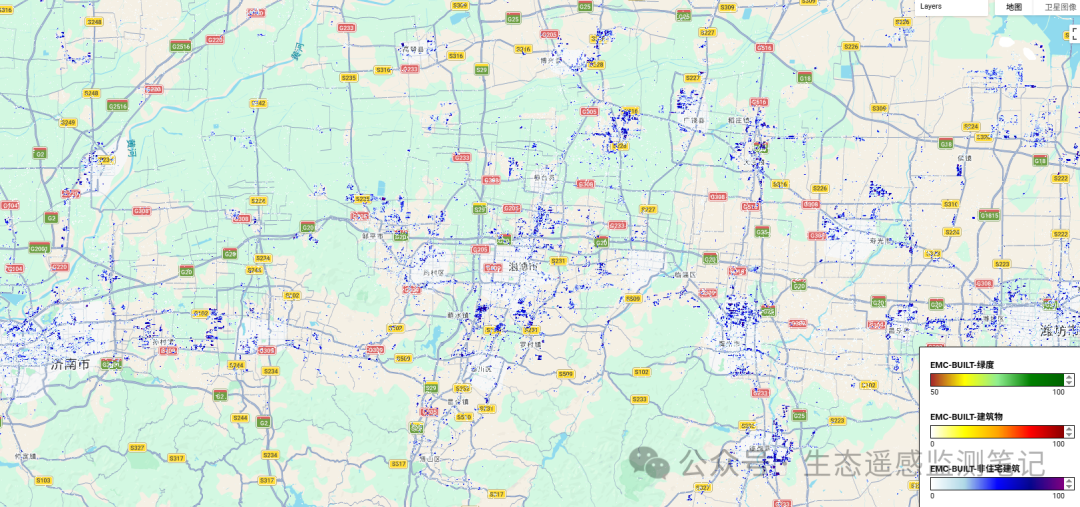
Map.addLayer(nres.mask(nres.neq(0)), nresVis, '非住宅建筑面积(平方米)');

// Calculate total built-up area in km² for the view
var areaKm2 = builtUp.multiply(ee.Image.pixelArea()).divide(1e6);
var stats = areaKm2.reduceRegion({
  reducer: ee.Reducer.sum(),
  geometry: Map.getBounds(true),
  scale: 100,
  maxPixels: 1e9
});

print('总建筑面积(平方公里):', stats);

// Function to interpolate between colors
function interpolateColor(color1, color2, factor) {
  var result = color1.slice();
  for (var i = 0; i < 3; i++) {
    result[i] = Math.round(result[i] + factor * (color2[i] - result[i]));
  }
  return result;
}

// Function to convert hex to RGB
function hexToRgb(hex) {
  var result = /^#?([a-f\d]{2})([a-f\d]{2})([a-f\d]{2})$/i.exec(hex);
  return result ? [
    parseInt(result[1], 16),
    parseInt(result[2], 16),
    parseInt(result[3], 16)
  ] : null;
}

// Function to convert color name to hex (basic colors)
function colorNameToHex(color) {
  var colors = {
    'white': '#FFFFFF', 'yellow': '#FFFF00', 'orange': '#FFA500',
    'red': '#FF0000', 'darkred': '#8B0000', 'lightblue': '#ADD8E6',
    'blue': '#0000FF', 'darkblue': '#00008B', 'purple': '#800080',
    'brown': '#A52A2A', 'lightgreen': '#90EE90', 'green': '#008000',
    'darkgreen': '#006400'
  };
  return colors[color.toLowerCase()] || color;
}

// Function to create a continuous gradient legend
function createContinuousLegend(title, min, max, palette) {
  var legendPanel = ui.Panel({
    style: {
      padding: '8px 8px 4px 8px',
      margin: '0 0 8px 0'
    }
  });

  // Title
  var legendTitle = ui.Label({
    value: title,
    style: {
      fontWeight: 'bold',
      fontSize: '13px',
      margin: '0 0 4px 0',
      padding: '0'
    }
  });
  legendPanel.add(legendTitle);

  // Create gradient bar using many small panels
  var gradientBar = ui.Panel({
    layout: ui.Panel.Layout.Flow('horizontal'),
    style: {
      height: '20px',
      margin: '0 0 2px 0',
      border: '1px solid black',
      padding: '0'
    }
  });

  // Convert palette to RGB
  var rgbPalette = palette.map(function(color) {
    return hexToRgb(colorNameToHex(color));
  });

  // Create 100 segments for smooth gradient
  var numSegments = 100;
  for (var i = 0; i < numSegments; i++) {
    var position = i / (numSegments - 1);
    var segmentIndex = position * (rgbPalette.length - 1);
    var lowerIndex = Math.floor(segmentIndex);
    var upperIndex = Math.ceil(segmentIndex);
    var factor = segmentIndex - lowerIndex;

    var color = interpolateColor(rgbPalette[lowerIndex], rgbPalette[upperIndex], factor);
    var hexColor = '#' + color.map(function(c) {
      var hex = c.toString(16);
      return hex.length === 1 ? '0' + hex : hex;
    }).join('');

    var segment = ui.Panel({
      style: {
        backgroundColor: hexColor,
        width: '2px',
        height: '20px',
        margin: '0',
        padding: '0'
      }
    });
    gradientBar.add(segment);
  }

  legendPanel.add(gradientBar);

  // Labels panel
  var labelsPanel = ui.Panel({
    layout: ui.Panel.Layout.Flow('horizontal'),
    style: {
      width: '202px',
      margin: '0',
      padding: '0'
    }
  });

  var minLabel = ui.Label({
    value: min.toString(),
    style: {
      fontSize: '11px',
      textAlign: 'left',
      stretch: 'horizontal',
      margin: '0',
      padding: '0'
    }
  });

  var maxLabel = ui.Label({
    value: max.toString(),
    style: {
      fontSize: '11px',
      textAlign: 'right',
      stretch: 'horizontal',
      margin: '0',
      padding: '0'
    }
  });

  labelsPanel.add(minLabel);
  labelsPanel.add(maxLabel);
  legendPanel.add(labelsPanel);

  return legendPanel;
}

// Create legends for each layer
var greennessLegend = createContinuousLegend('EMC-BUILT-绿度', 50, 100, greennessVis.palette);
var builtUpLegend = createContinuousLegend('EMC-BUILT-建筑物', 0, 100, builtUpVis.palette);
var nresLegend = createContinuousLegend('EMC-BUILT-非住宅建筑', 0, 100, nresVis.palette);

// Combine all legends into one panel
var legendContainer = ui.Panel({
  widgets: [greennessLegend, builtUpLegend, nresLegend],
  layout: ui.Panel.Layout.Flow('vertical'),
  style: {
    position: 'bottom-right',
    padding: '8px',
    backgroundColor: 'white',
    border: '1px solid black'
  }
});

Map.add(legendContainer);
02
—
结果展示
区域展示1
区域展示2
区域展示3
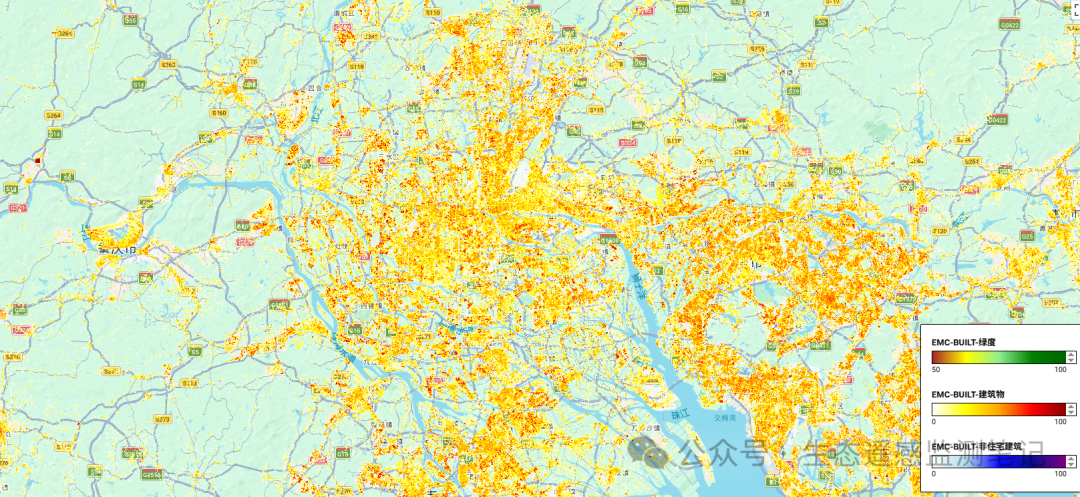
区域展示4
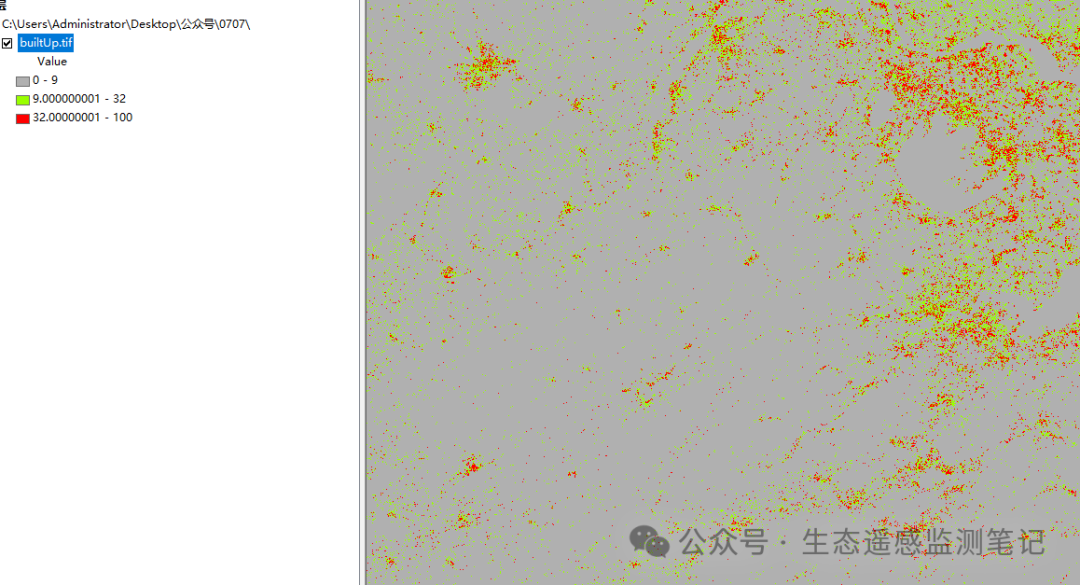
下载后展示
请在微信客户端打开
请在微信客户端打开
代码完整链接请在微信公众号后台私信“
Copernicus EMC-BUILT全球地表数据集
”
感谢关注,欢迎转发!
声明:仅供学习使用!
希望关注的朋友们转发,如果对你有帮助的话记得给小编点个赞或者在看!

汇聚全球AI编程工具,助力开发者即刻编程。
更多推荐
 4
4 0
0- 0


 已为社区贡献2条内容

所有评论(0)