
【KNN算法】实现手写数字识别
·
数据介绍
通过网盘分享的文件:手写数字识别.csv等2个文件
链接: https://pan.baidu.com/s/1ft633i3HvJtCY1W4_bO5Kg?pwd=8888 提取码: 8888
- 数据文件train.csv 和test.csv 包含从0到9的手绘数字的灰度图像的像素信息。
- 每个图像高28像素,宽28像素,共784个像素。
- 每个像素取值范围[0,255],取值越大意味着该像素颜色越深
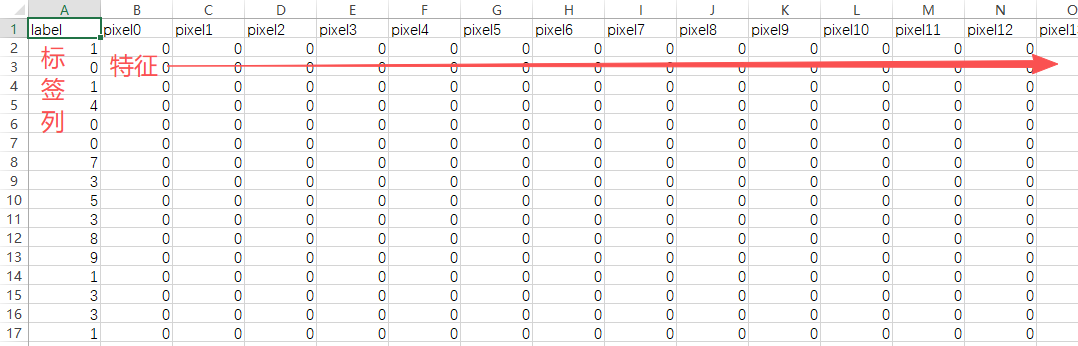
- 训练数据集(train.csv)共785列。第一列为"标签”,为该图片对应的手写数字。其余784列为该图像的像素值
- 训练集中的特征名称均有pixel前缀,后面的数字([0,783])代表了像素的序号
csv文件中的数据不完全截图:
导包
import matplotlib.pyplot as plt
import pandas as pd
from sklearn.model_selection import train_test_split, GridSearchCV
from sklearn.neighbors import KNeighborsClassifier
from sklearn.metrics import accuracy_score
from collections import Counter
import joblib    # 保存模型
绘制像素图
根据提供的数据,画出对应的手写图像。
# 定义函数,根据像素值绘制相应图像
def plot_digit(idx):
    # 1.读取数据
    df = pd.read_csv("E:/数据分析材料/手写数字识别.csv")  # [42000 rows x 785 columns]
    # print(df)

    # 2.判断索引有没有越界
    if idx < 0 or idx >len(df)-1:
        print("索引越界!")

    # 3.如果走到这,说明索引没问题
    # 像素信息
    feature = df.iloc[:,1:]
    # 标签信息
    label = df.iloc[:,0]
    print(f'绘制图像对应值为:{label[idx]}')

    # 4.查看像素信息的形状
    print(f'像素数据的形状为:{feature.iloc[idx].shape}')  # (784,)
    # 因为图片是像素 28*28 的,所以我们要将(784,)转成28*28的格式
    feature = feature.iloc[idx].values.reshape(28,28)
    # print(f'像素修改后的格式为:{feature}')

    # 5.查看标签分布情况
    print(f'所有标签的分布情况:{Counter(label)}')

    # 6.具体的绘制
    plt.imshow(feature,cmap='gray')  # 灰度图
    plt.axis('off') # 不显示坐标轴
    plt.show()

if __name__ == '__main__':
    # 传入的是索引值,不是excel边的索引
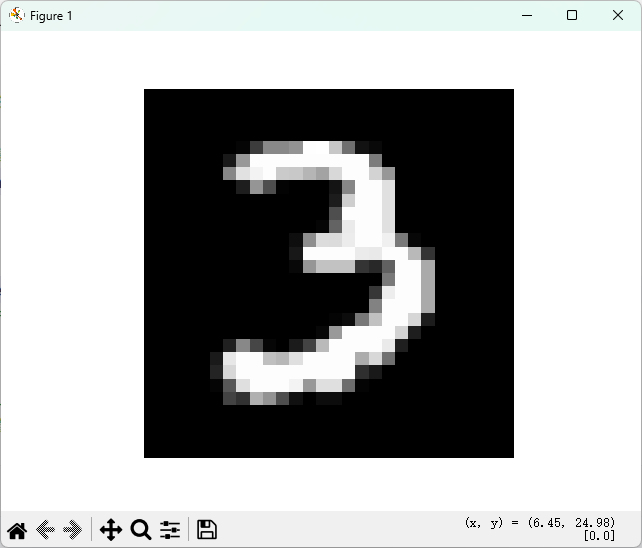
    plot_digit(9)
运行结果:

训练模型并保存
def train_model():
    # 读取数据
    df = pd.read_csv('E:/数据分析材料/手写数字识别.csv')
    # 分层 特征 与 标签
    x = df.iloc[:,1:]
    y = df.iloc[:,0]

    # 分割 训练集 和 测试集
    # 参1:特征集 参2:标签集 参3:测试集占比 参4:保证每次运行分割结果一样  参5:参考y轴进行抽取,保持标签比例(数据均衡)
    x_train, x_test,y_train,y_test = train_test_split(x,y,test_size=0.2,random_state=20,stratify=y)
    # 模型训练
    # 创建模型
    estimator = KNeighborsClassifier()
    # 可能选取的参数
    param_dict = {'n_neighbors':[i for i in range(1,11)]}
    # 进行交叉验证和网格搜索
    estimator = GridSearchCV(estimator,param_dict,cv=4)
    # 模型训练
    estimator.fit(x_train,y_train)
    # 选取效果最好的模型
    estimator = estimator.best_estimator_

    # 模型评估
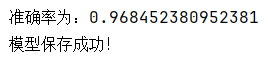
    print(f'准确率为:{accuracy_score(y_test,estimator.predict(x_test))}')

    # 保存模型
    joblib.dump(estimator,'./my_nodel/手写数字识别.pkl')
    print("模型保存成功!")
if __name__ == '__main__':
    # 传入的是索引值,不是excel边的索引
    # plot_digit(9)
    train_model()
运行结果:
使用模型
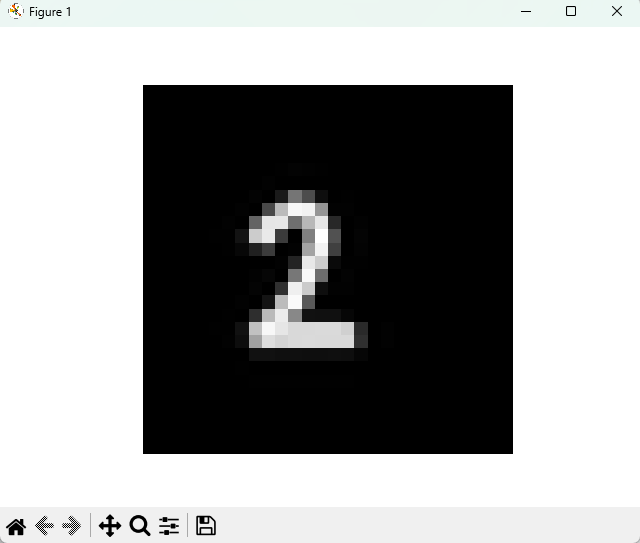
使用上面保存的模型,给它对一个新的图片进行识别,看看识别结果是否准确。
def use_model():
    # 加载图片
    x = plt.imread('E:/数据分析材料/demo.png')
    # x = Image.open('E:/数据分析材料/demo.png').convert('L').resize((28, 28))
    # print(x)
    # 绘制图片
    plt.imshow(x,cmap='gray')
    plt.axis('off')
    plt.show()
    # 因为我上面训练的特征是 (1,784) 而当前的图片是 28*28,所以我们要转换一下
    print(f'图片的形状:{x.shape}')
    x = x.reshape(1,784)

    # 归一化  因为plt加载图片的时候给它归一化了 所以要反向让它在(0,255)区间
    x = x*255
    # 加载模型
    estimator = joblib.load('./my_nodel/手写数字识别.pkl')
    y_pred = estimator.predict(x)
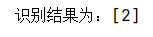
    print(f'识别结果为:{y_pred}')
if __name__ == '__main__':
    # 传入的是索引值,不是excel边的索引
    # plot_digit(9)
    # train_model()
    use_model()
运行结果:

汇聚全球AI编程工具,助力开发者即刻编程。
更多推荐
 6
6 0
0- 0


 已为社区贡献5条内容

所有评论(0)