
大规模ML模型监控:监控大规模机器学习模型的运行状态
·
大规模ML模型监控:监控大规模机器学习模型的运行状态
一、大规模ML模型监控概述
1.1 大规模ML模型监控的定义
大规模ML模型监控是指在生产环境中持续监控和管理大规模机器学习模型运行状态的系统化过程。它通过实时收集模型的性能指标、预测结果、数据质量和业务影响,帮助团队及时发现问题、诊断根因并优化模型性能。
1.2 大规模ML模型监控的价值
| 价值维度 | 具体体现 | 量化指标 |
|---|---|---|
| 性能保障 | 确保模型预测质量 | 准确率下降<5% |
| 漂移检测 | 及时发现数据/概念漂移 | 漂移检测时间<1小时 |
| 成本优化 | 优化资源使用 | 成本降低30% |
| 业务保障 | 保障业务价值 | 业务指标影响<1% |
| 合规要求 | 满足监管合规 | 审计通过率100% |
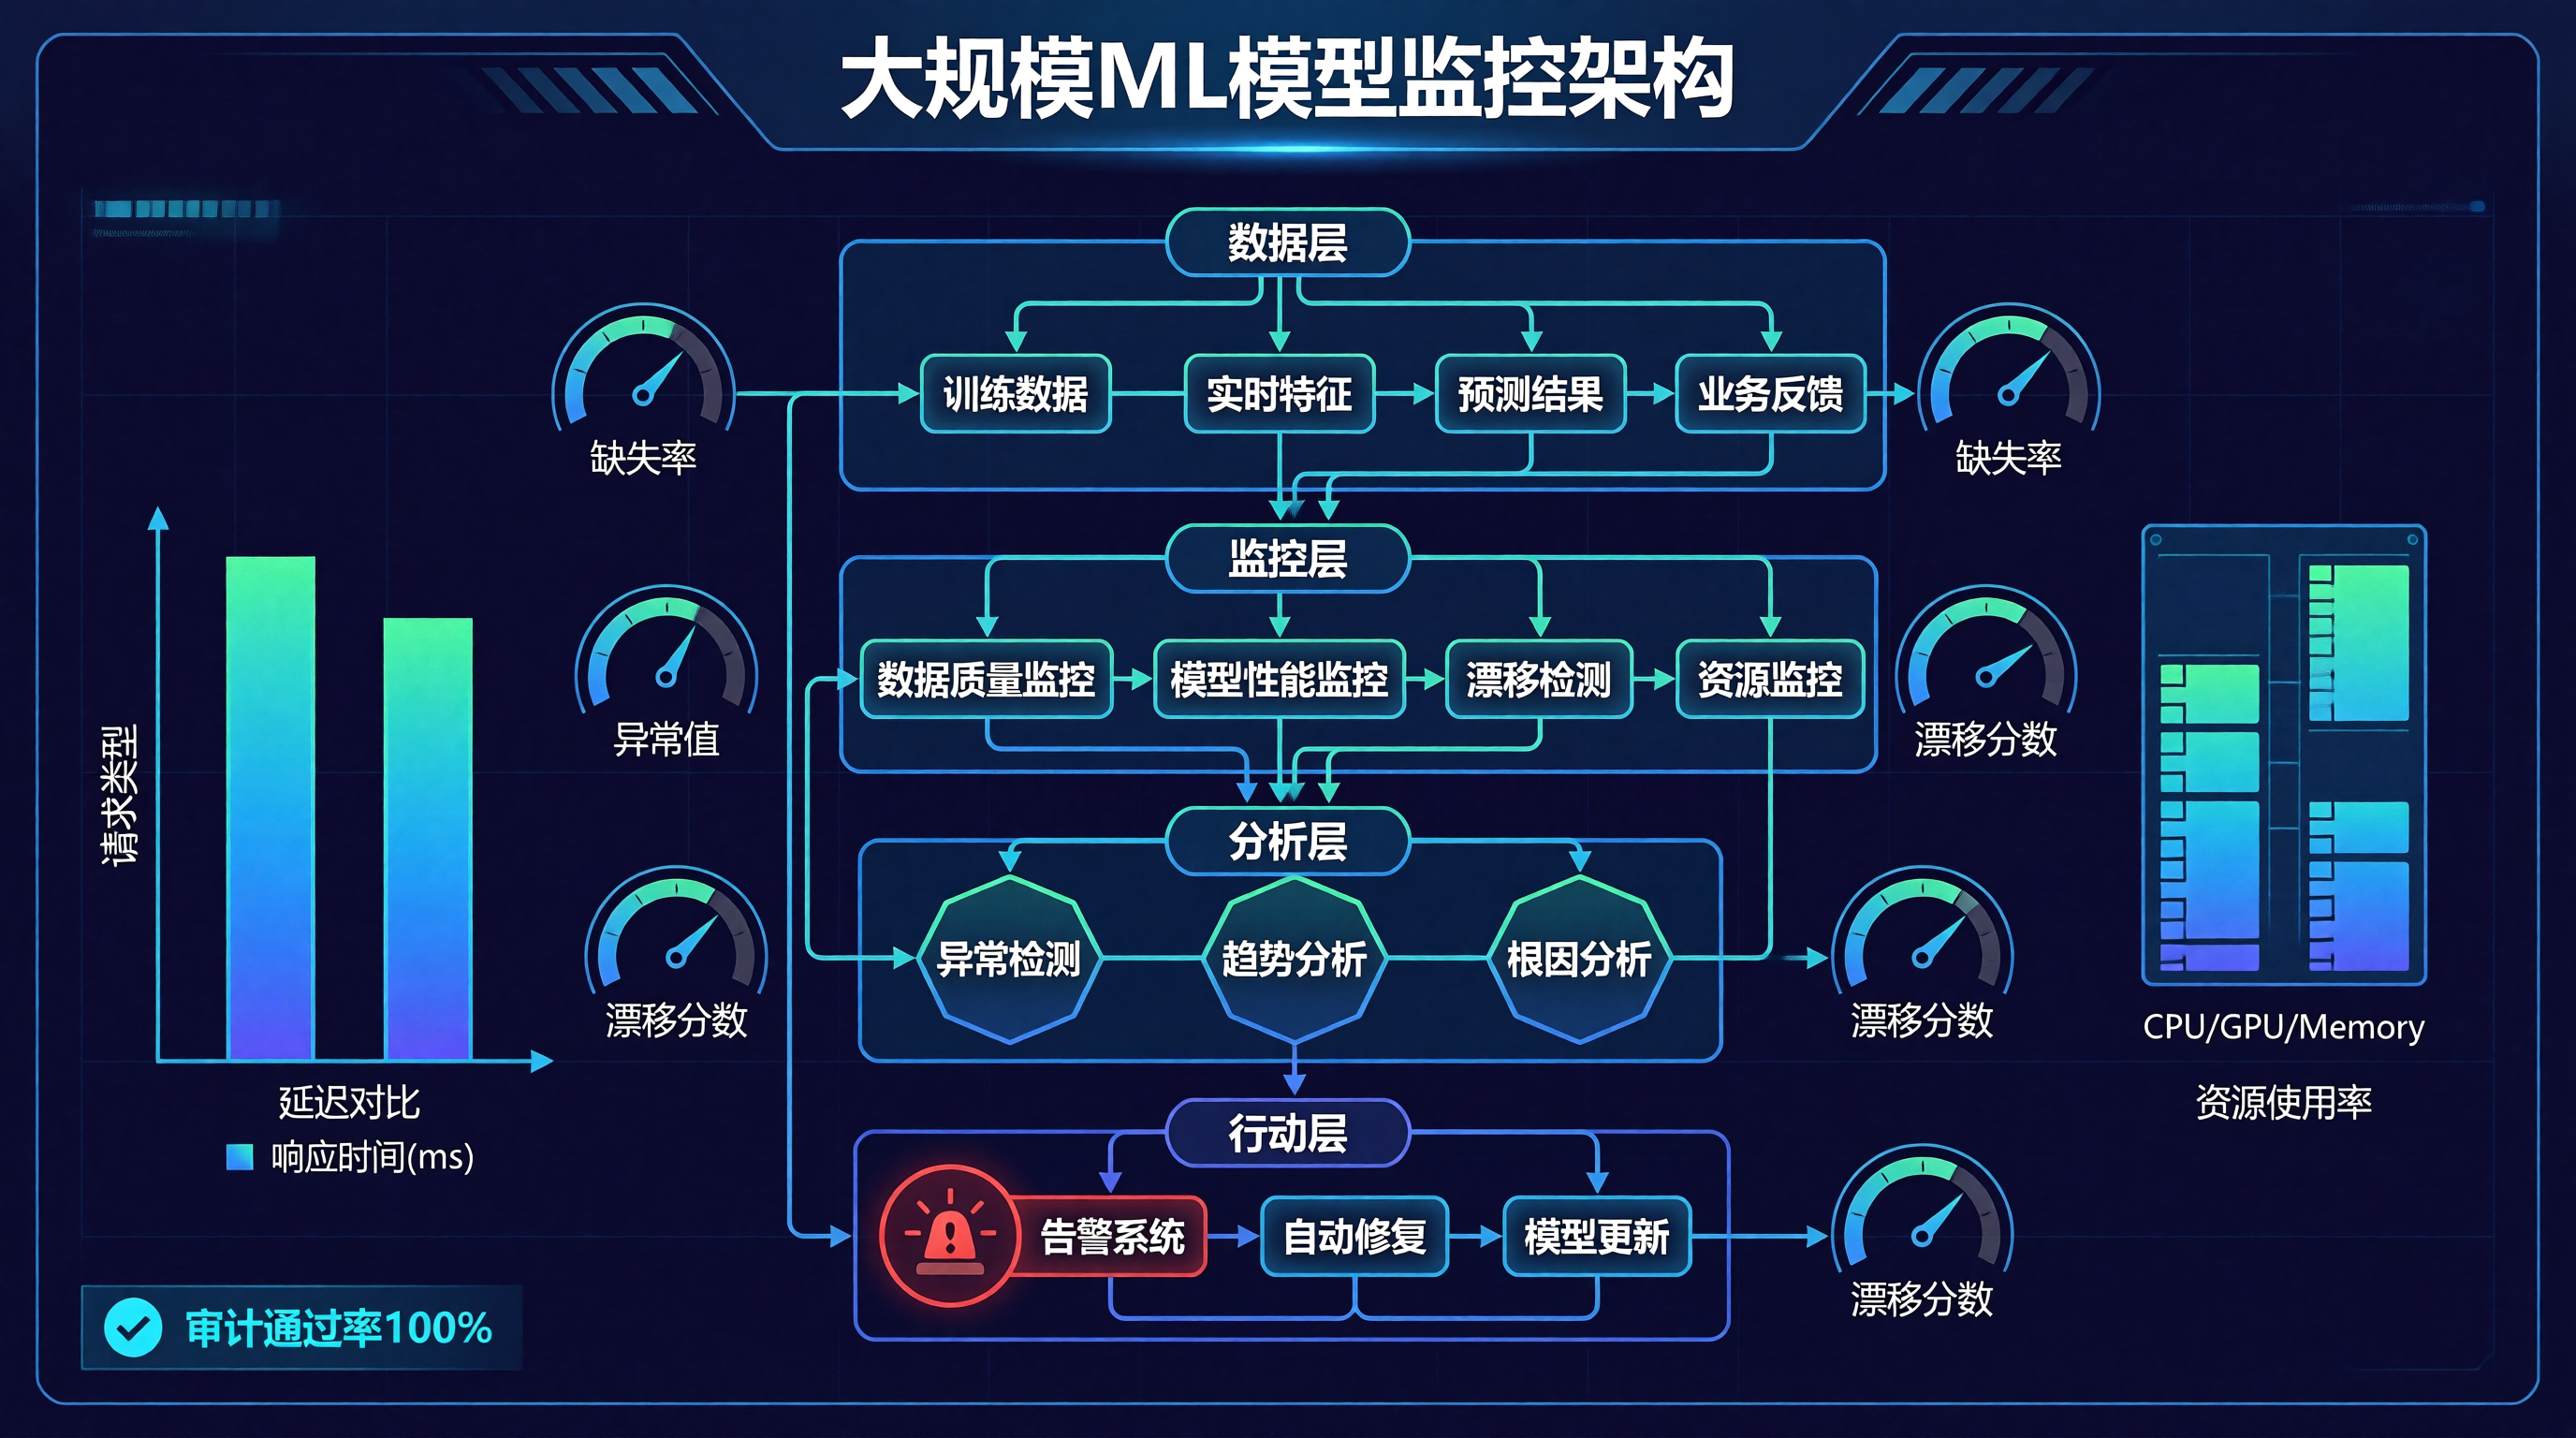
1.3 监控架构
flowchart TB
    subgraph 数据层
        A[训练数据]
        B[实时特征]
        C[预测结果]
        D[业务反馈]
    end

    subgraph 监控层
        E[数据质量监控]
        F[模型性能监控]
        G[漂移检测]
        H[资源监控]
    end

    subgraph 分析层
        I[异常检测]
        J[趋势分析]
        K[根因分析]
    end

    subgraph 行动层
        L[告警系统]
        M[自动修复]
        N[模型更新]
    end

    A --> E
    B --> E
    C --> F
    D --> F
    E --> G
    F --> G
    E --> I
    F --> I
    G --> J
    I --> K
    K --> L
    K --> M
    K --> N
二、监控维度详解
2.1 数据质量监控
class DataQualityMonitor:
    def __init__(self):
        self.thresholds = {
            'missing_rate': 0.1,
            'outlier_rate': 0.05,
            'drift_score': 0.3
        }

    def check_quality(self, features):
        """检查数据质量"""
        issues = []

        # 缺失值检查
        missing_rate = self._calculate_missing_rate(features)
        if missing_rate > self.thresholds['missing_rate']:
            issues.append({'type': 'missing', 'score': missing_rate})

        # 异常值检查
        outlier_rate = self._calculate_outlier_rate(features)
        if outlier_rate > self.thresholds['outlier_rate']:
            issues.append({'type': 'outlier', 'score': outlier_rate})

        # 数据漂移检查
        drift_score = self._calculate_drift_score(features)
        if drift_score > self.thresholds['drift_score']:
            issues.append({'type': 'drift', 'score': drift_score})

        return issues

    def _calculate_missing_rate(self, df):
        return df.isnull().sum().mean() / len(df)

    def _calculate_outlier_rate(self, df):
        # 使用IQR方法检测异常值
        return 0.0  # 简化实现

    def _calculate_drift_score(self, df):
        # 使用KS检验检测分布变化
        return 0.0  # 简化实现
2.2 模型性能监控
# 模型性能监控配置
metrics:
  classification:
    - name: accuracy
      threshold:
        min: 0.85
    - name: precision
      threshold:
        min: 0.80
    - name: recall
      threshold:
        min: 0.80
    - name: f1_score
      threshold:
        min: 0.80

  regression:
    - name: rmse
      threshold:
        max: 10.0
    - name: mae
      threshold:
        max: 5.0
    - name: r2_score
      threshold:
        min: 0.70
2.3 模型漂移监控
from scipy.stats import ks_2samp
import numpy as np

class DriftDetector:
    def __init__(self, reference_data):
        self.reference_data = reference_data
        self.drift_threshold = 0.05

    def detect_drift(self, new_data, feature_name):
        """检测单特征漂移"""
        ref_dist = self.reference_data[feature_name]
        new_dist = new_data[feature_name]

        # KS检验
        stat, p_value = ks_2samp(ref_dist, new_dist)

        return {
            'feature': feature_name,
            'statistic': stat,
            'p_value': p_value,
            'is_drifted': p_value < self.drift_threshold
        }

    def detect_multivariate_drift(self, new_data):
        """检测多变量漂移"""
        drift_results = []
        for feature in self.reference_data.columns:
            if feature in new_data.columns:
                result = self.detect_drift(new_data, feature)
                drift_results.append(result)

        return drift_results
三、监控架构设计
3.1 数据采集层
# 采集器配置
collectors:
  - name: prometheus_exporter
    type: metrics
    config:
      port: 8080
      metrics_path: /metrics

  - name: logging_collector
    type: logs
    config:
      log_level: INFO
      format: json

  - name: tracing_collector
    type: traces
    config:
      sampling_rate: 0.1
      exporter: jaeger
3.2 存储层
# 存储配置
storage:
  metrics:
    type: prometheus
    config:
      retention: 30d
      remote_write:
        - url: http://prometheus:9090/api/v1/write

  logs:
    type: elasticsearch
    config:
      hosts: ["http://elasticsearch:9200"]
      index_pattern: "ml-logs-*"

  traces:
    type: jaeger
    config:
      collector_endpoint: http://jaeger:14268/api/traces
3.3 分析层
class MLMonitorAnalyzer:
    def __init__(self):
        self.anomaly_detector = IsolationForest(contamination=0.05)

    def analyze_metrics(self, metrics):
        """分析监控指标"""
        analysis = {
            'performance': self._analyze_performance(metrics),
            'drift': self._analyze_drift(metrics),
            'anomalies': self._detect_anomalies(metrics)
        }
        return analysis

    def _analyze_performance(self, metrics):
        """分析性能趋势"""
        return {'trend': 'stable', 'confidence': 0.95}

    def _analyze_drift(self, metrics):
        """分析漂移情况"""
        return {'drift_detected': False, 'severity': 'low'}

    def _detect_anomalies(self, metrics):
        """检测异常"""
        return []
四、告警系统
4.1 告警规则配置
groups:
- name: ml_model_alerts
  rules:
  - alert: ModelAccuracyDrop
    expr: avg(ml_model_accuracy[5m]) < 0.85
    for: 10m
    labels:
      severity: critical
      model: recommendation
    annotations:
      summary: "模型准确率下降"
      description: "模型准确率低于85%,当前值: {{ $value }}"

  - alert: DataDriftDetected
    expr: ml_data_drift_score > 0.3
    for: 5m
    labels:
      severity: warning
    annotations:
      summary: "数据漂移检测"
      description: "检测到数据分布变化,漂移分数: {{ $value }}"

  - alert: HighLatency
    expr: avg(ml_model_inference_latency[5m]) > 500
    for: 5m
    labels:
      severity: warning
    annotations:
      summary: "推理延迟过高"
      description: "平均推理延迟超过500ms"
4.2 告警通知
receivers:
- name: team-ml
  webhook_configs:
  - url: https://hooks.slack.com/services/XXX
    send_resolved: true
  email_configs:
  - to: ml-team@example.com
    send_resolved: true
五、实践案例
5.1 推荐系统监控
# 推荐模型监控配置
model:
  name: recommendation-v2
  type: classification
  features:
    - user_id
    - item_id
    - timestamp
    - context

  monitoring:
    data_quality:
      enabled: true
      checks:
        - missing_values
        - outliers
        - data_drift

    performance:
      enabled: true
      metrics:
        - accuracy
        - precision
        - recall

    drift:
      enabled: true
      features:
        - all_numeric

    alerts:
      slack:
        channel: #ml-alerts
      pagerduty:
        enabled: true
5.2 实时监控仪表盘
{
  "dashboard": {
    "title": "ML模型监控仪表盘",
    "panels": [
      {
        "title": "模型准确率",
        "type": "graph",
        "target": "avg(ml_model_accuracy[1m])"
      },
      {
        "title": "推理延迟",
        "type": "graph",
        "target": "avg(ml_model_latency[1m])"
      },
      {
        "title": "数据漂移分数",
        "type": "gauge",
        "target": "ml_data_drift_score"
      },
      {
        "title": "资源使用率",
        "type": "graph",
        "target": "avg(ml_resource_cpu_usage[1m])"
      }
    ]
  }
}
六、挑战与解决方案
6.1 主要挑战
| 挑战 | 描述 | 解决方案 |
|---|---|---|
| 数据量大 | 大规模模型产生海量监控数据 | 采样、聚合、分层存储 |
| 实时性要求 | 需要实时检测和响应 | 流处理架构、低延迟管道 |
| 模型复杂性 | 复杂模型难以解释 | 可解释AI工具、特征重要性分析 |
| 成本管理 | 监控本身产生成本 | 智能采样、按需监控 |
6.2 最佳实践
1. 分层监控
monitoring_levels:
  critical:  # 核心指标,实时监控
    frequency: 1s
    retention: 7d

  important:  # 重要指标,定期监控
    frequency: 1m
    retention: 30d

  informational:  # 参考指标,抽样监控
    frequency: 5m
    retention: 90d
2. 智能采样
class SmartSampler:
    def __init__(self):
        self.default_rate = 0.1
        self.anomaly_rate = 1.0

    def should_sample(self, context):
        """根据上下文决定是否采样"""
        if context.get('is_anomalous'):
            return True, self.anomaly_rate
        return np.random.random() < self.default_rate, self.default_rate
七、总结
大规模ML模型监控是保障生产环境中模型可靠性和性能的关键。通过多层次、多维度的监控体系,可以及时发现问题并采取行动。
在实践中需要关注:
- 数据质量:持续监控输入数据的质量和分布
- 模型性能:跟踪模型的预测准确性和稳定性
- 漂移检测:检测数据和概念漂移
- 告警系统:建立完善的告警和响应机制
随着ML模型规模的增长和复杂度的提升,监控体系将变得越来越重要,为模型的可靠运行提供保障。

汇聚全球AI编程工具,助力开发者即刻编程。
更多推荐

 1
1 0
0- 0


 已为社区贡献124条内容

所有评论(0)