
【大数据】癌症数据分析与可视化系统 Hadoop+Spark技术 计算机毕业设计项目 Anaconda环境配置 附源码+文档+讲解
前言
💖💖作者:计算机程序员小杨
💙💙个人简介:我是一名计算机相关专业的从业者,擅长Java、微信小程序、Python、Golang、安卓Android等多个IT方向。会做一些项目定制化开发、代码讲解、答辩教学、文档编写、也懂一些降重方面的技巧。热爱技术,喜欢钻研新工具和框架,也乐于通过代码解决实际问题,大家有技术代码这一块的问题可以问我!
💛💛想说的话:感谢大家的关注与支持!
💕💕文末获取源码联系 计算机程序员小杨
💜💜
网站实战项目
安卓/小程序实战项目
大数据实战项目
深度学习实战项目
计算机毕业设计选题
💜💜
一.开发工具简介
大数据框架:Hadoop+Spark(本次没用Hive,支持定制)
开发语言:Python
后端框架:Django
前端:Vue
详细技术点:Hadoop、HDFS、Spark、Spark SQL、Pandas、NumPy
数据库:MySQL
二.系统内容简介
基于大数据的癌症数据分析与可视化系统采用了Hadoop与Spark作为核心的大数据处理框架,通过HDFS实现海量癌症数据的分布式存储,利用Spark SQL完成数据的快速查询与分析操作。系统后端使用Django框架进行开发,前端则采用Vue技术栈构建交互界面,数据处理过程中结合Pandas和NumPy库对癌症相关数据进行清洗、转换以及统计计算。在功能设计方面,系统提供了癌症概览分析模块用于展示整体的癌症数据分布情况,临床方案分析模块帮助医疗工作者了解不同治疗方案的应用效果,人口统计分析模块从年龄、性别、地域等维度对患者群体进行分类统计,癌症时间分析模块追踪癌症发病的时间趋势变化,患者生存分析模块通过生存率、生存期等指标评估治疗效果。系统还配备了用户管理与个人中心管理功能,方便不同角色的使用者登录并查看相应权限下的数据内容,系统管理模块则负责维护整个平台的正常运行,包括数据源配置、日志记录等基础性工作,通过这样的方式将大数据技术与医疗数据分析相结合,为癌症研究提供了技术支撑。
三.系统功能演示
四.系统界面展示
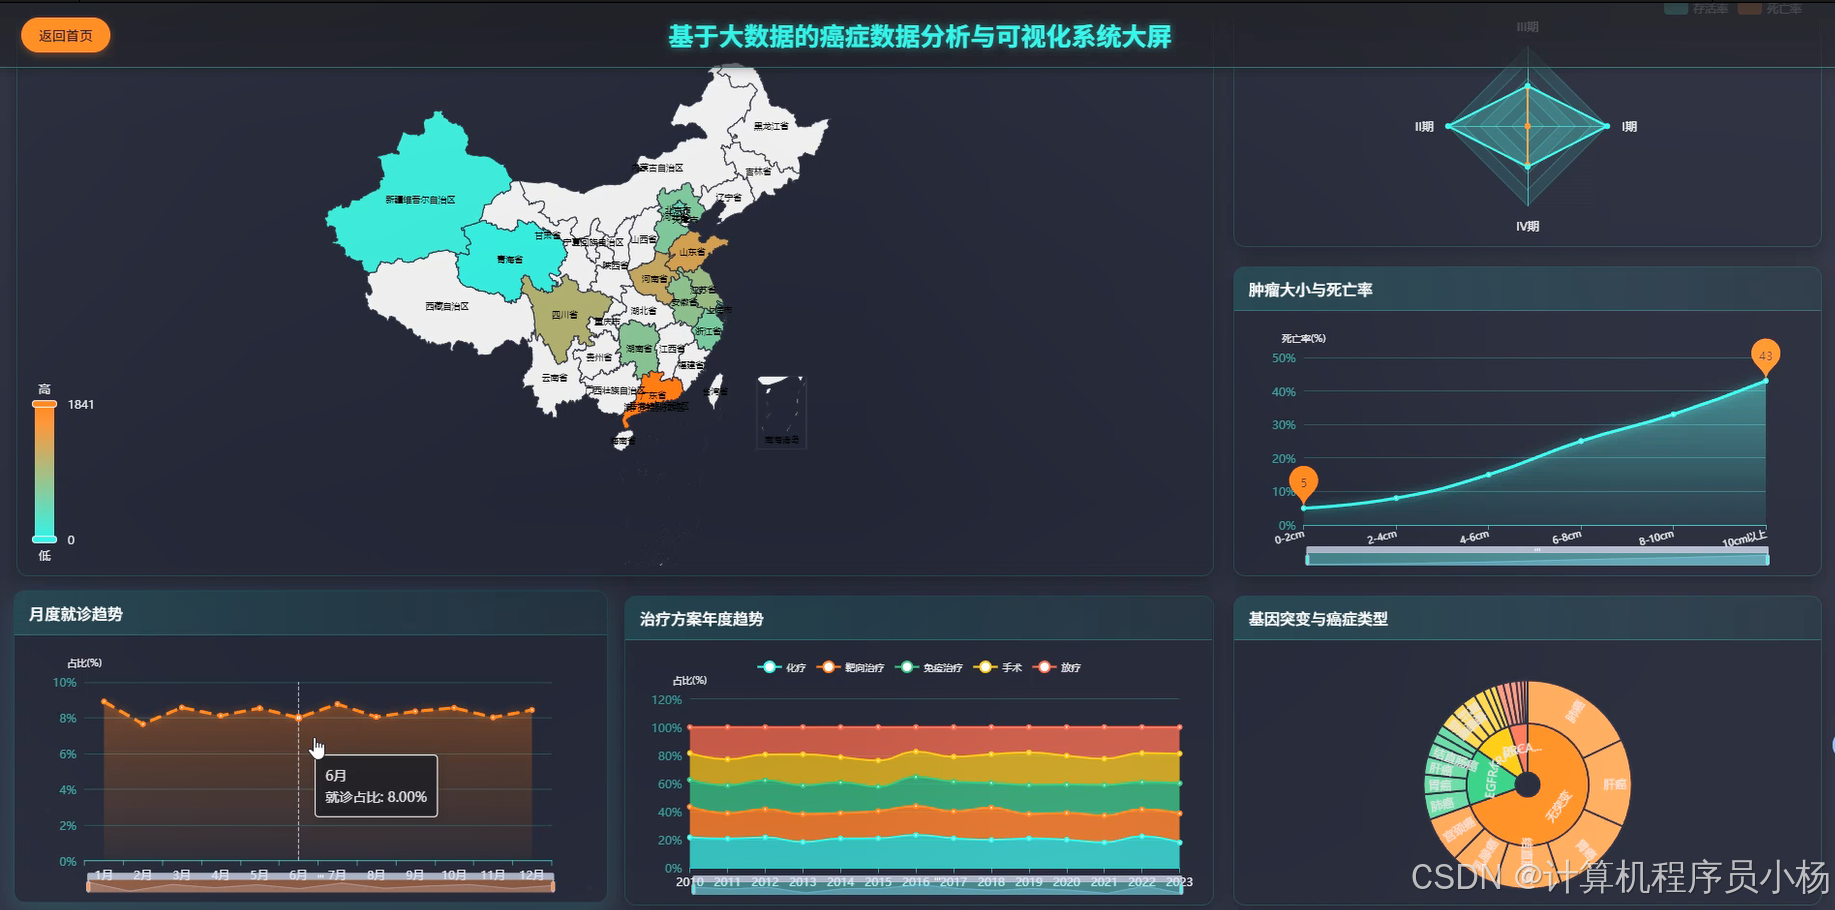
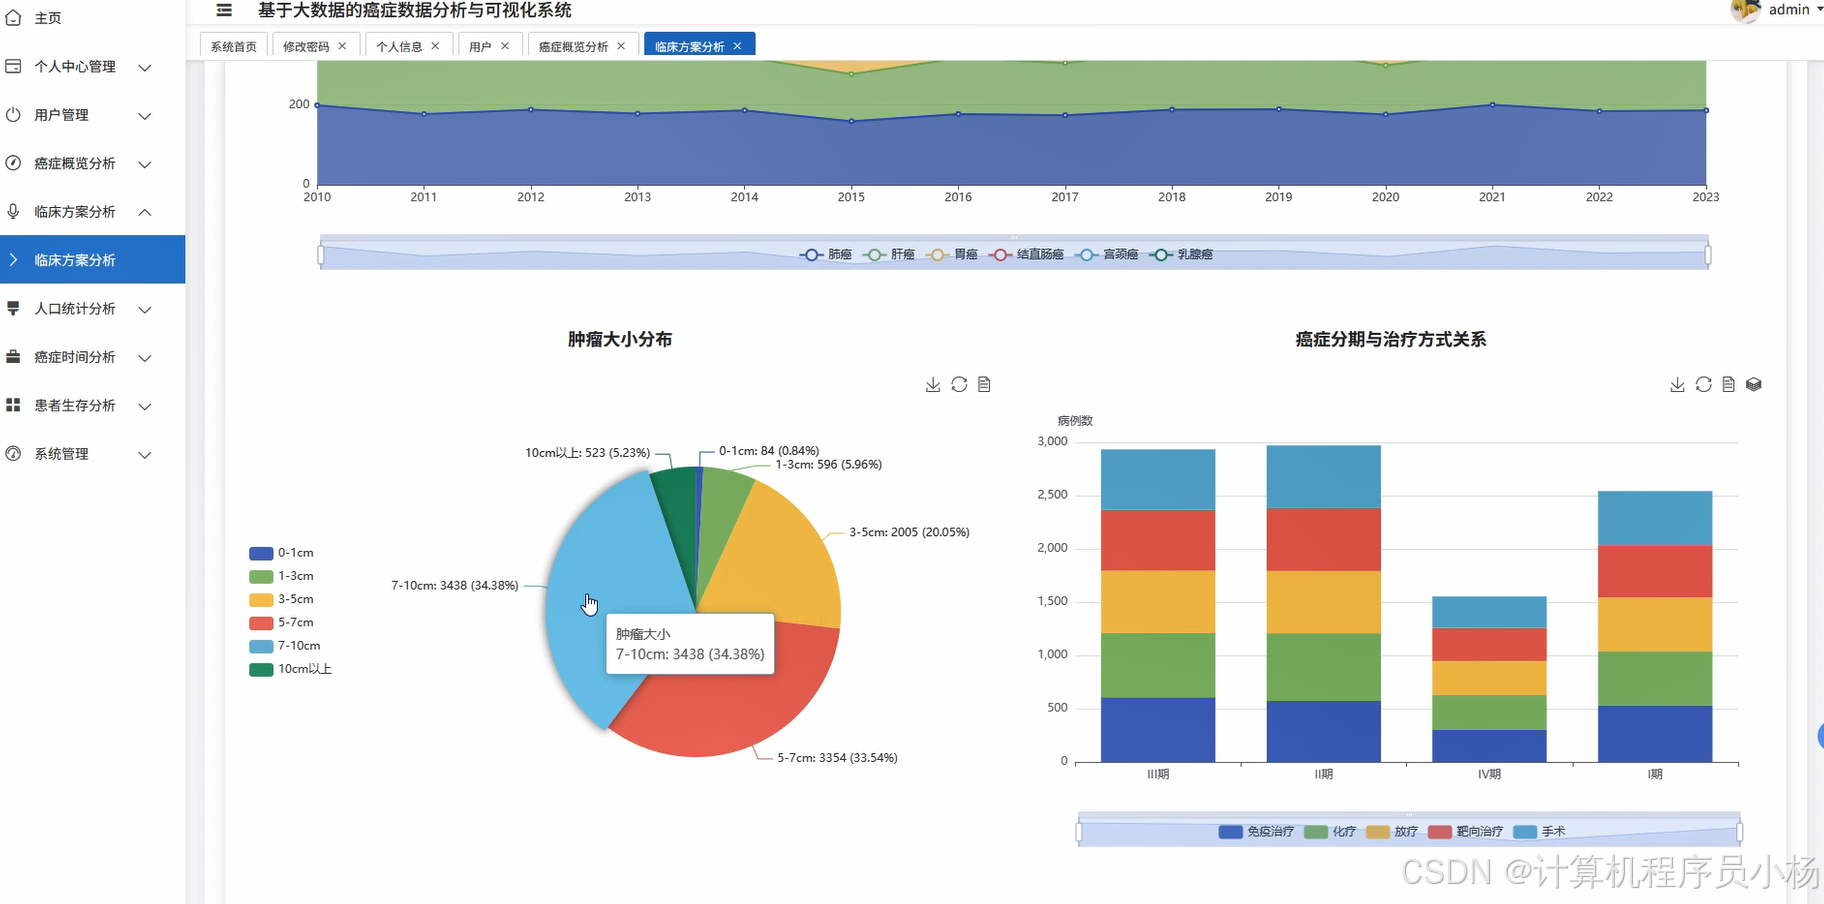
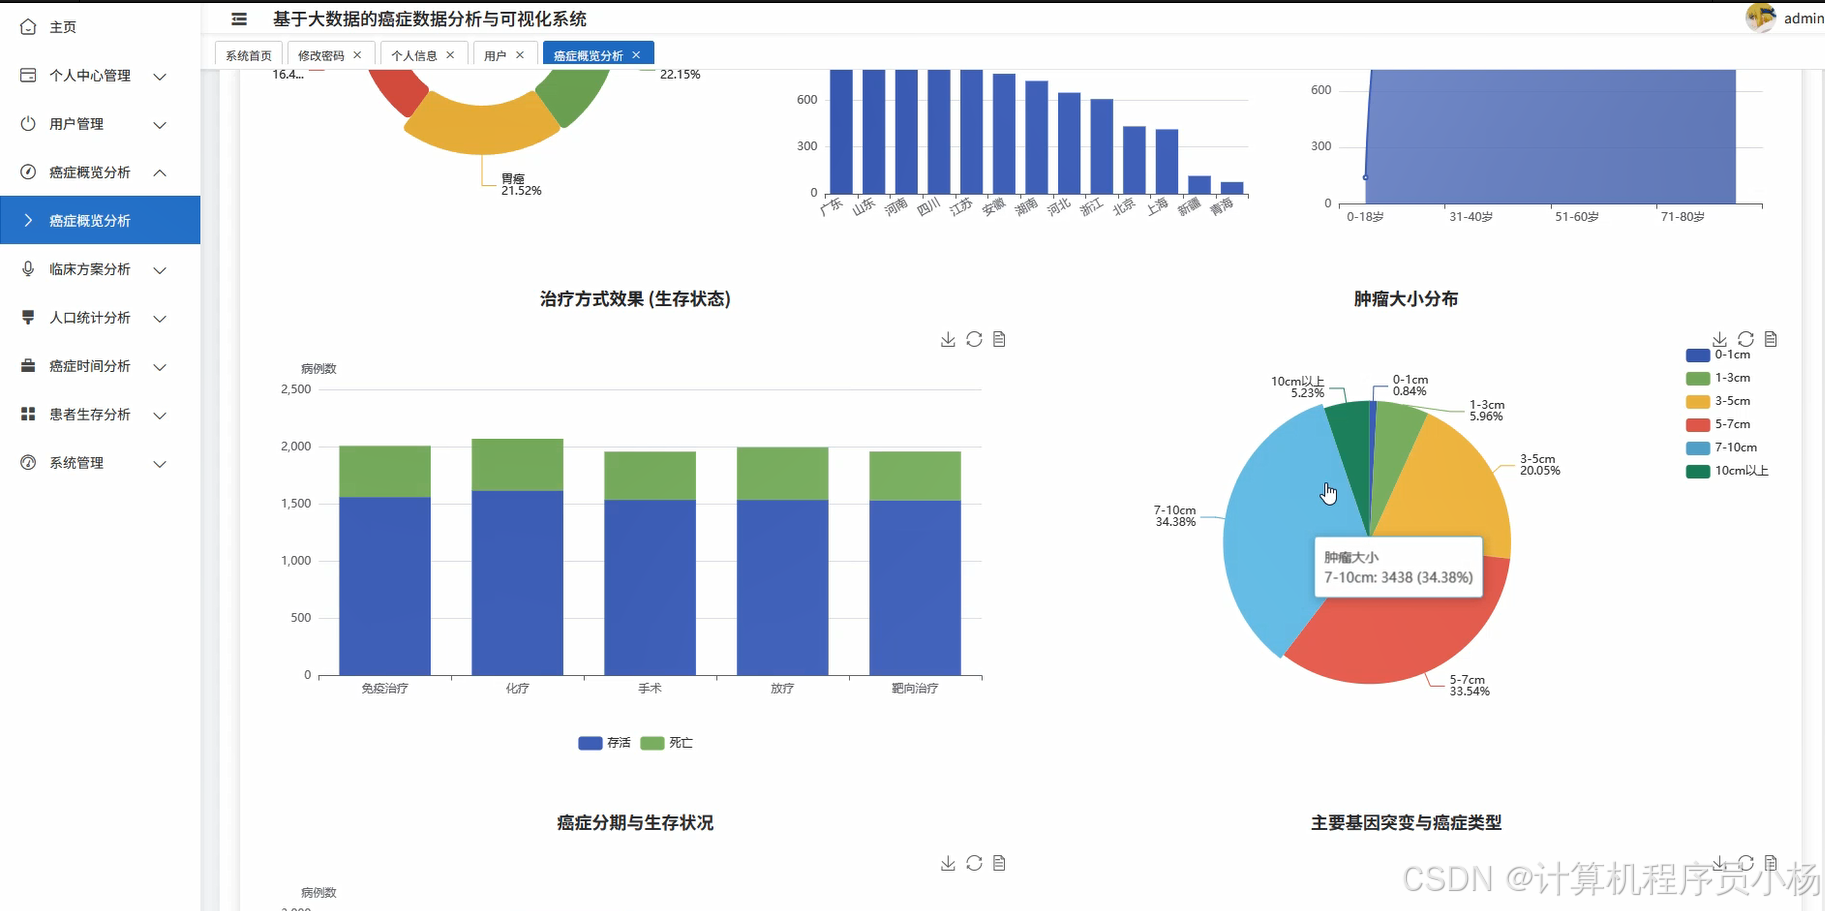
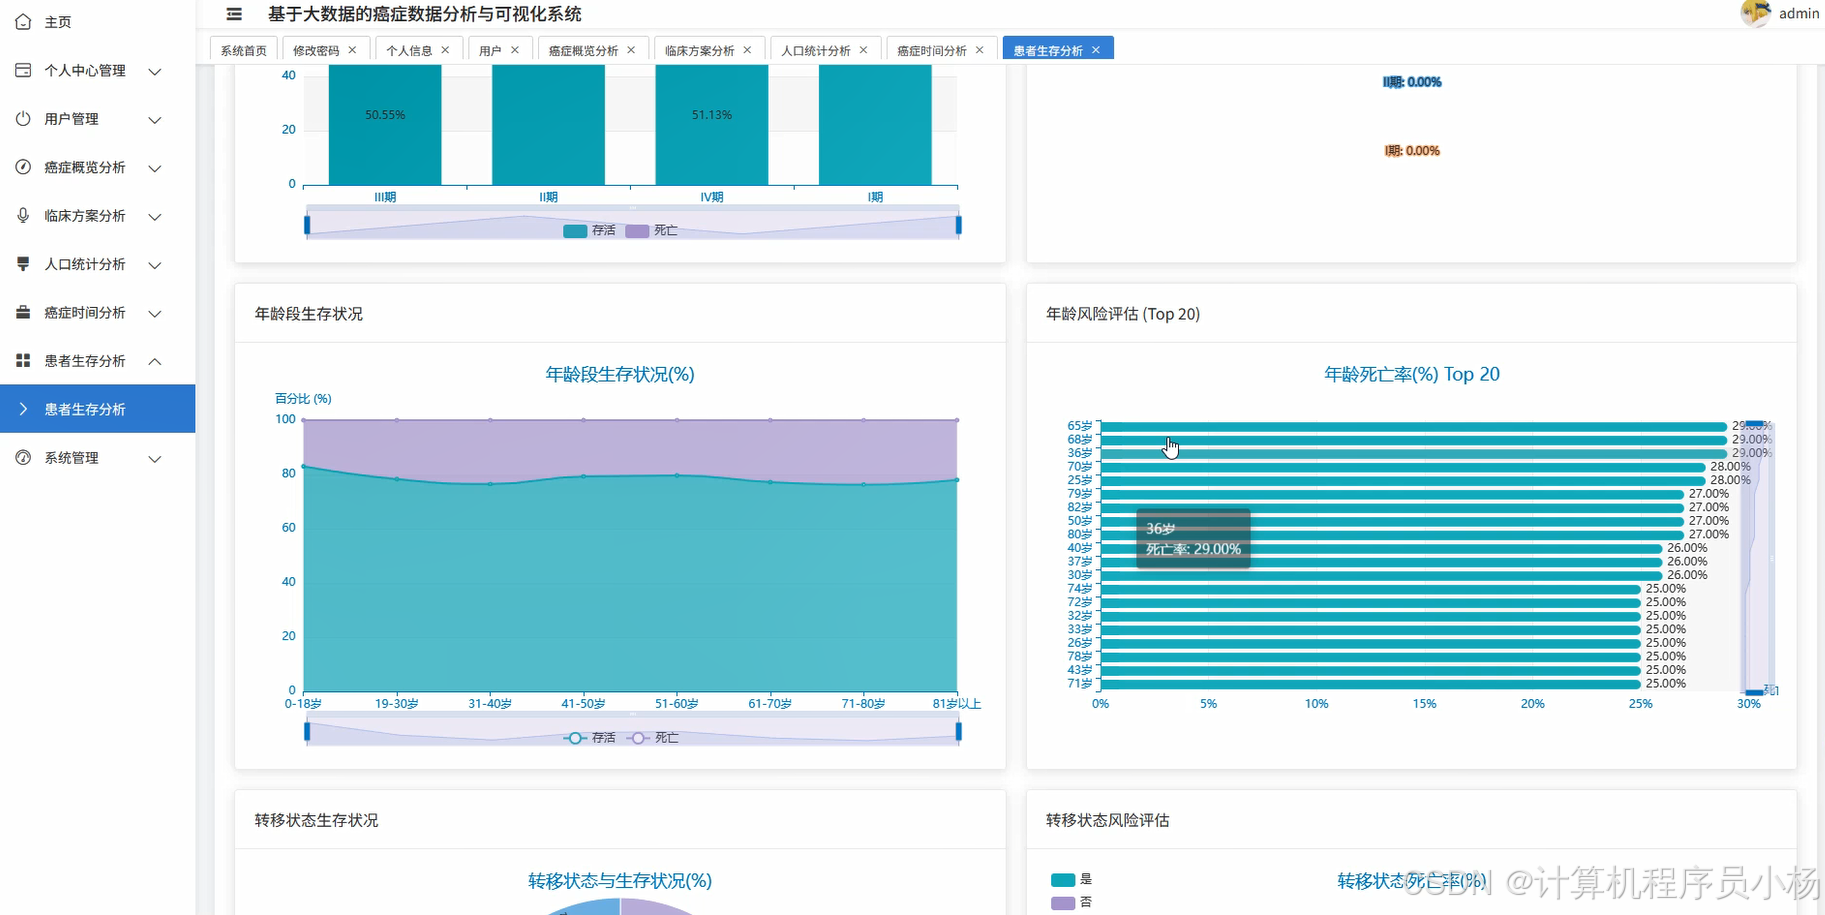
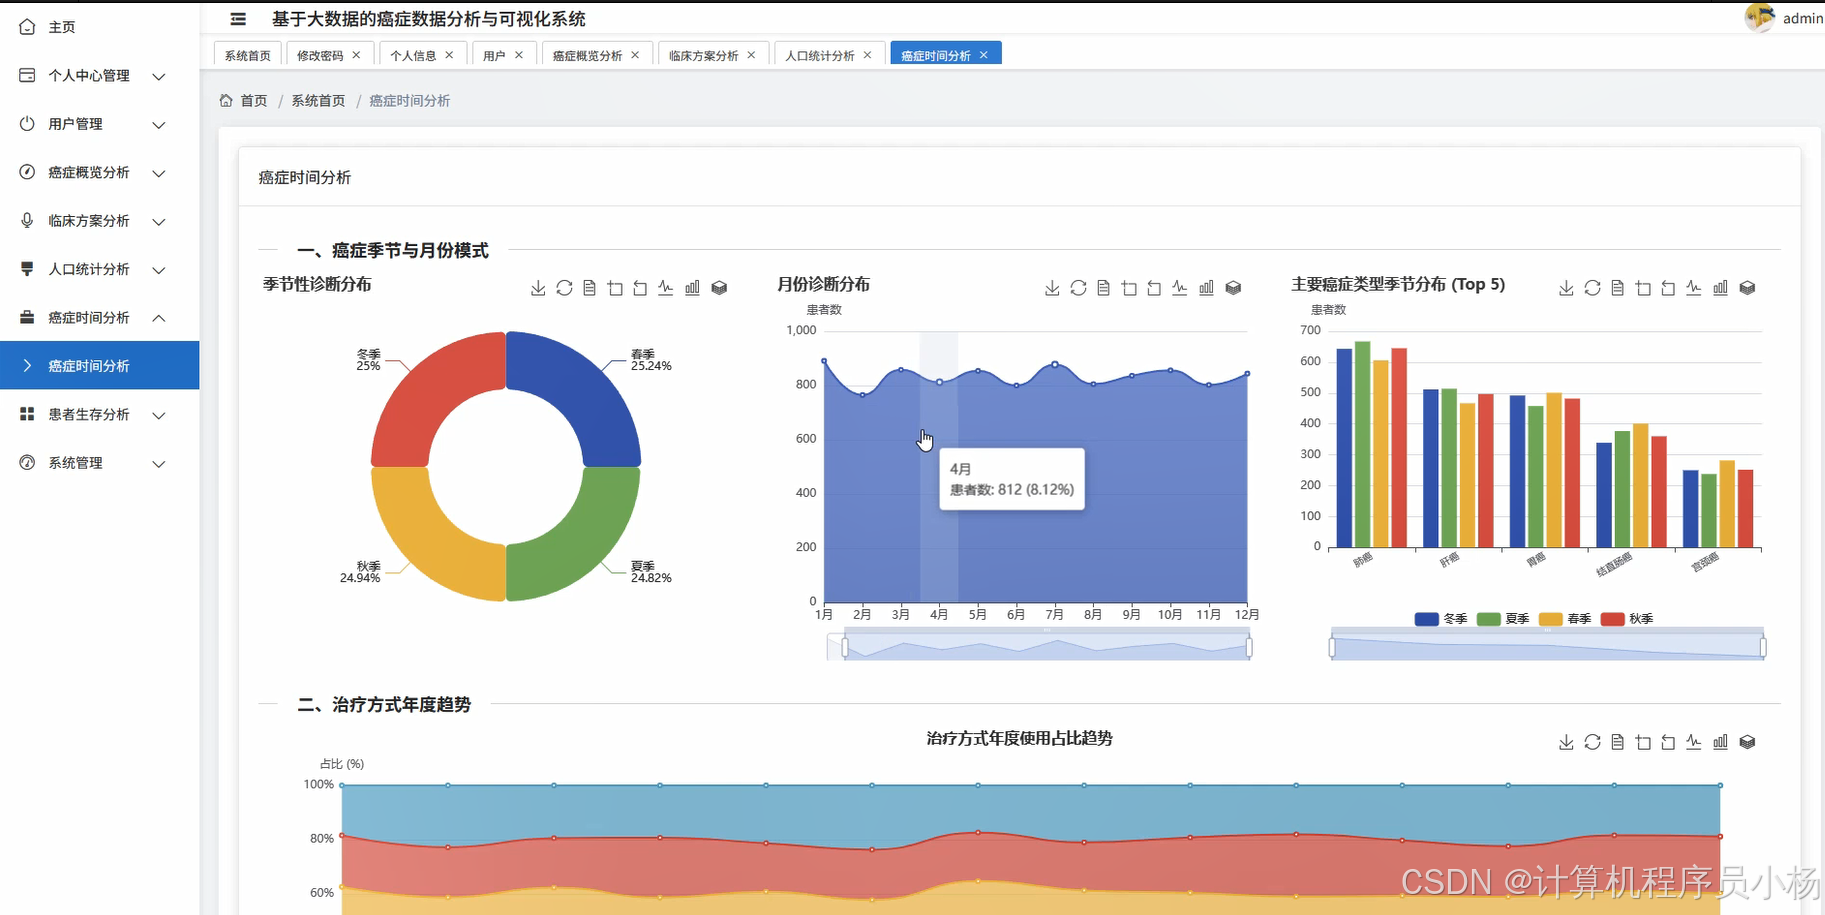
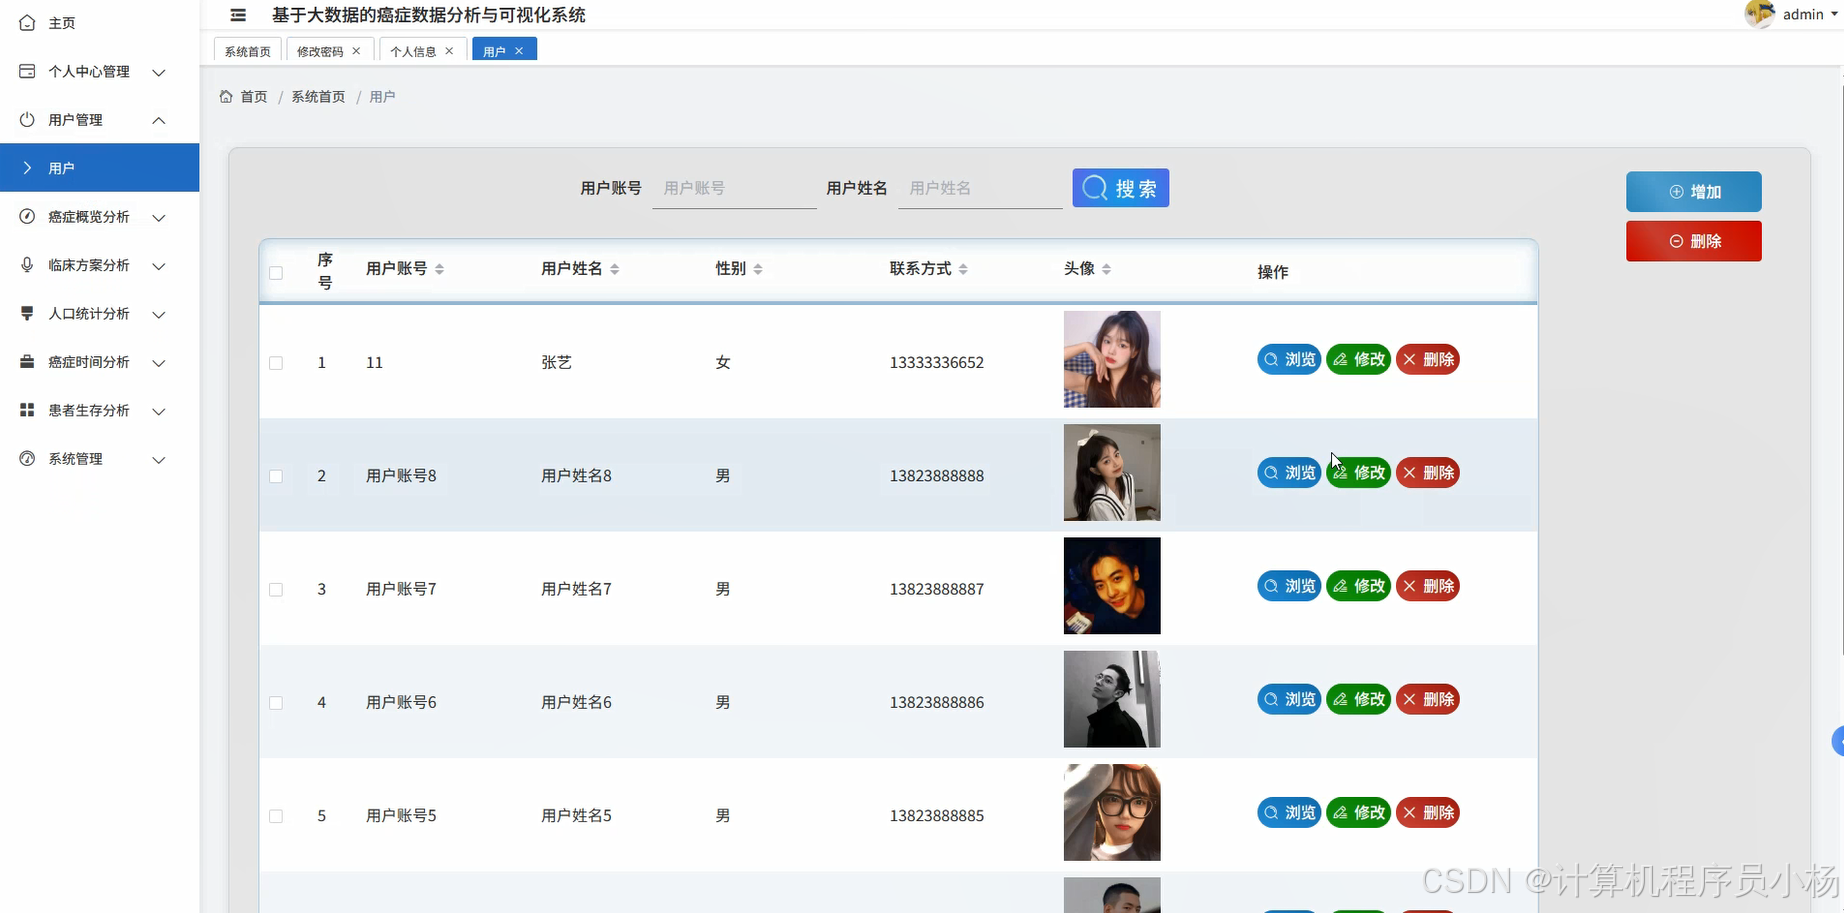
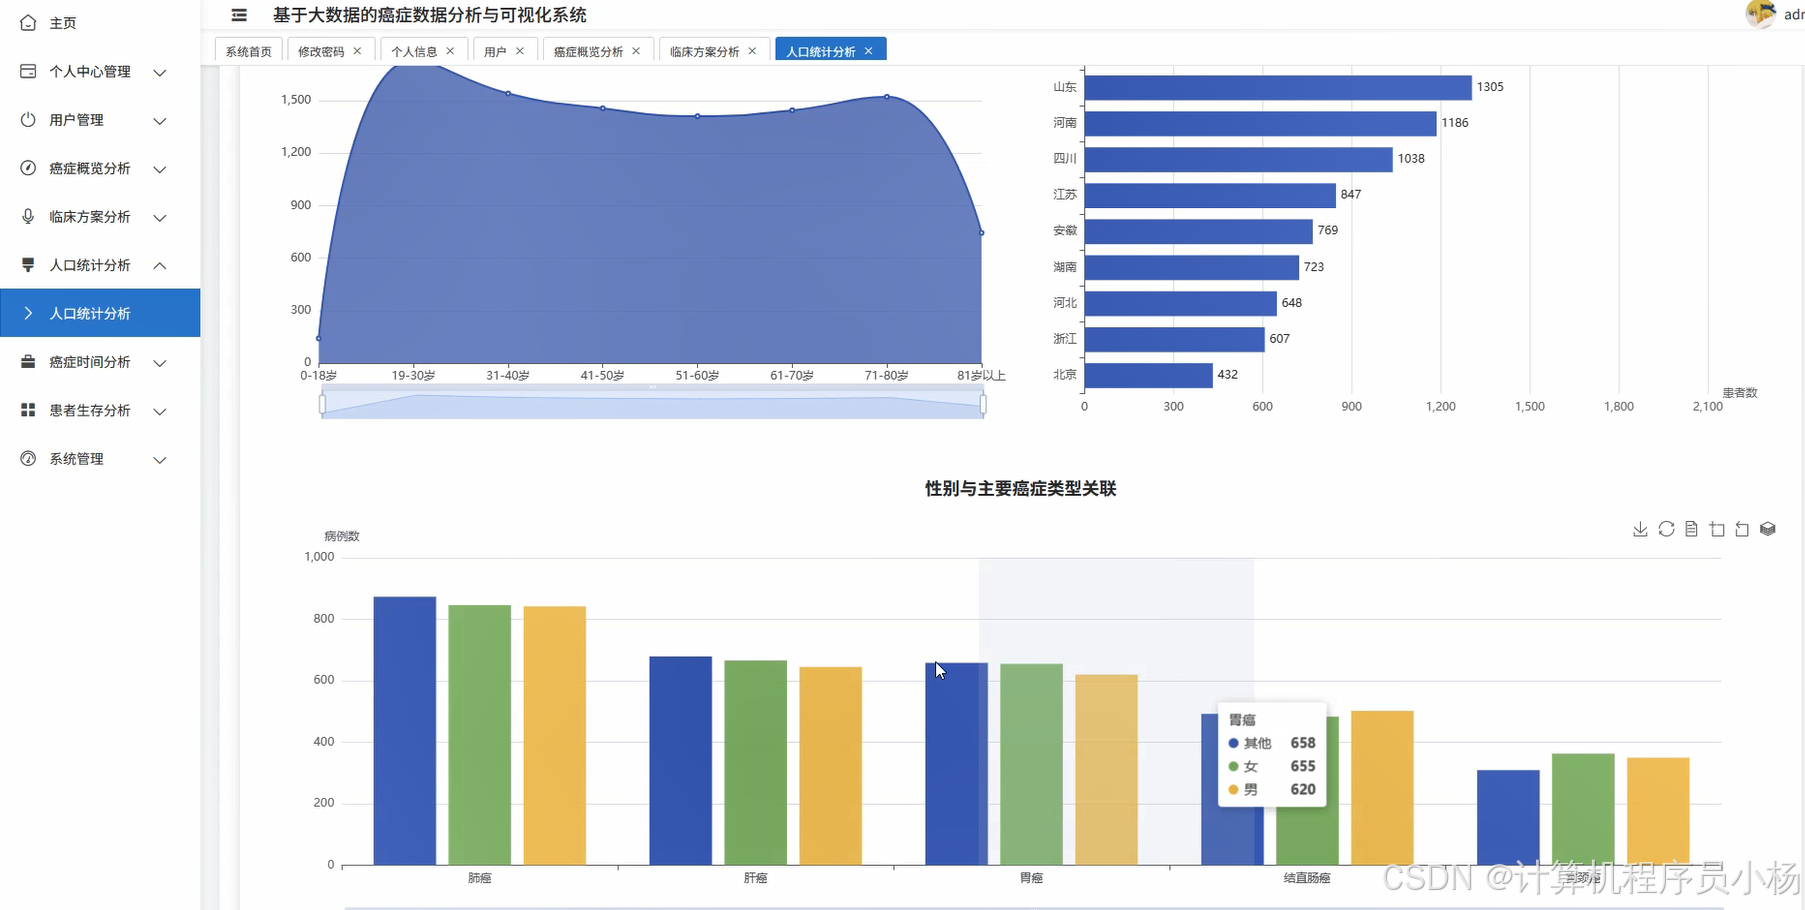
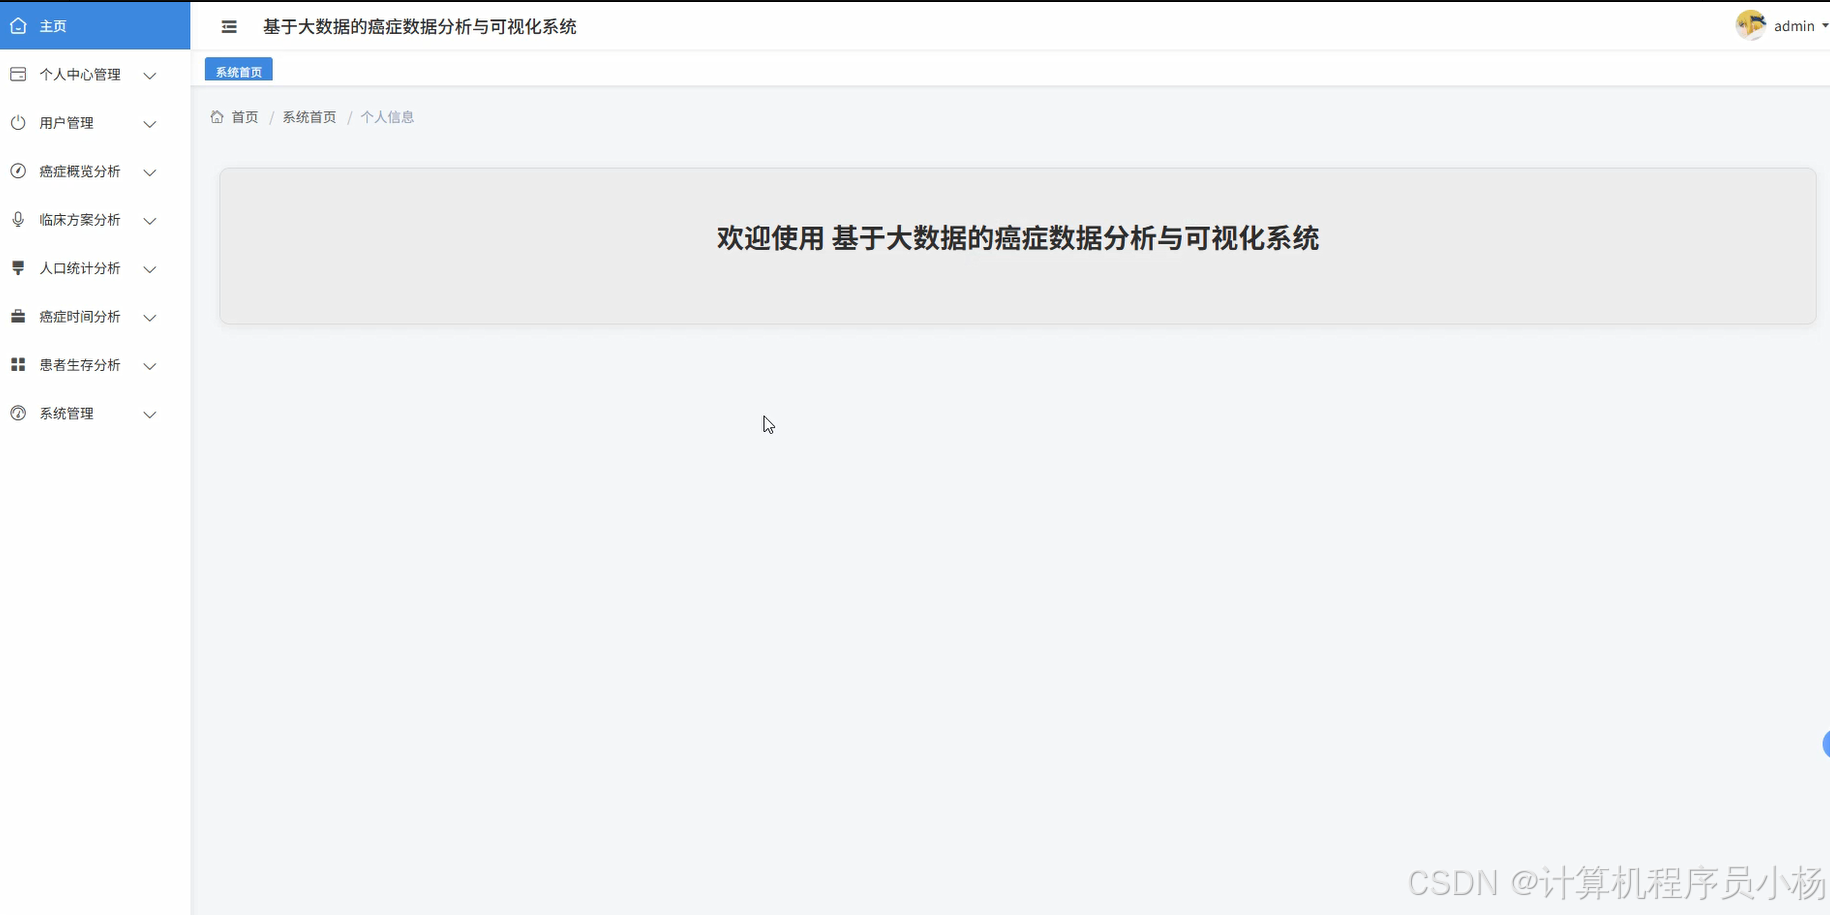
五.系统源码展示
from pyspark.sql import SparkSession
from pyspark.sql.functions import col, count, avg, sum, when, year, month, datediff, current_date
from django.http import JsonResponse
from django.views import View
import pandas as pd
import numpy as np
from datetime import datetime
import json
spark = SparkSession.builder.appName("CancerDataAnalysis").config("spark.sql.warehouse.dir", "/user/hive/warehouse").config("spark.executor.memory", "4g").config("spark.driver.memory", "2g").getOrCreate()
class CancerOverviewAnalysis(View):
    def get(self, request):
        try:
            cancer_data_path = "hdfs://localhost:9000/cancer_data/patient_records.csv"
            df = spark.read.csv(cancer_data_path, header=True, inferSchema=True)
            df.createOrReplaceTempView("cancer_records")
            cancer_type_stats = spark.sql("SELECT cancer_type, COUNT(*) as patient_count, AVG(age) as avg_age FROM cancer_records GROUP BY cancer_type ORDER BY patient_count DESC")
            cancer_type_list = cancer_type_stats.collect()
            result_data = []
            for row in cancer_type_list:
                cancer_info = {
                    "cancer_type": row["cancer_type"],
                    "patient_count": row["patient_count"],
                    "avg_age": round(row["avg_age"], 2) if row["avg_age"] else 0
                }
                result_data.append(cancer_info)
            gender_distribution = df.groupBy("cancer_type", "gender").agg(count("*").alias("count"))
            gender_stats = gender_distribution.collect()
            gender_data = {}
            for row in gender_stats:
                cancer_type = row["cancer_type"]
                if cancer_type not in gender_data:
                    gender_data[cancer_type] = {"male": 0, "female": 0}
                if row["gender"] == "男":
                    gender_data[cancer_type]["male"] = row["count"]
                elif row["gender"] == "女":
                    gender_data[cancer_type]["female"] = row["count"]
            stage_distribution = df.groupBy("cancer_type", "stage").agg(count("*").alias("count"))
            stage_stats = stage_distribution.collect()
            stage_data = {}
            for row in stage_stats:
                cancer_type = row["cancer_type"]
                if cancer_type not in stage_data:
                    stage_data[cancer_type] = {}
                stage_data[cancer_type][row["stage"]] = row["count"]
            total_patients = df.count()
            avg_diagnosis_age = df.agg(avg("age")).collect()[0][0]
            response_result = {
                "cancer_types": result_data,
                "gender_distribution": gender_data,
                "stage_distribution": stage_data,
                "total_patients": total_patients,
                "avg_diagnosis_age": round(avg_diagnosis_age, 2) if avg_diagnosis_age else 0,
                "status": "success"
            }
            return JsonResponse(response_result, safe=False)
        except Exception as e:
            return JsonResponse({"status": "error", "message": str(e)})
class ClinicalTreatmentAnalysis(View):
    def get(self, request):
        try:
            treatment_data_path = "hdfs://localhost:9000/cancer_data/treatment_records.csv"
            df = spark.read.csv(treatment_data_path, header=True, inferSchema=True)
            df.createOrReplaceTempView("treatment_records")
            treatment_effectiveness = spark.sql("SELECT treatment_type, cancer_type, COUNT(*) as case_count, AVG(CAST(effectiveness_score as FLOAT)) as avg_effectiveness, SUM(CASE WHEN treatment_result = '有效' THEN 1 ELSE 0 END) as effective_count, SUM(CASE WHEN treatment_result = '无效' THEN 1 ELSE 0 END) as ineffective_count FROM treatment_records GROUP BY treatment_type, cancer_type")
            treatment_stats = treatment_effectiveness.collect()
            treatment_result_list = []
            for row in treatment_stats:
                effectiveness_rate = (row["effective_count"] / row["case_count"] * 100) if row["case_count"] > 0 else 0
                treatment_info = {
                    "treatment_type": row["treatment_type"],
                    "cancer_type": row["cancer_type"],
                    "case_count": row["case_count"],
                    "avg_effectiveness": round(row["avg_effectiveness"], 2) if row["avg_effectiveness"] else 0,
                    "effective_count": row["effective_count"],
                    "ineffective_count": row["ineffective_count"],
                    "effectiveness_rate": round(effectiveness_rate, 2)
                }
                treatment_result_list.append(treatment_info)
            treatment_duration = df.groupBy("treatment_type").agg(avg("treatment_days").alias("avg_duration"), avg("treatment_cost").alias("avg_cost"))
            duration_stats = treatment_duration.collect()
            duration_data = {}
            for row in duration_stats:
                duration_data[row["treatment_type"]] = {
                    "avg_duration": round(row["avg_duration"], 2) if row["avg_duration"] else 0,
                    "avg_cost": round(row["avg_cost"], 2) if row["avg_cost"] else 0
                }
            side_effects_analysis = df.groupBy("treatment_type", "side_effects").agg(count("*").alias("count"))
            side_effects_stats = side_effects_analysis.collect()
            side_effects_data = {}
            for row in side_effects_stats:
                treatment_type = row["treatment_type"]
                if treatment_type not in side_effects_data:
                    side_effects_data[treatment_type] = {}
                side_effects_data[treatment_type][row["side_effects"]] = row["count"]
            combination_therapy = spark.sql("SELECT treatment_combination, COUNT(*) as usage_count, AVG(CAST(effectiveness_score as FLOAT)) as combination_effectiveness FROM treatment_records WHERE treatment_combination IS NOT NULL GROUP BY treatment_combination ORDER BY usage_count DESC LIMIT 10")
            combination_stats = combination_therapy.collect()
            combination_list = []
            for row in combination_stats:
                combination_list.append({
                    "combination": row["treatment_combination"],
                    "usage_count": row["usage_count"],
                    "effectiveness": round(row["combination_effectiveness"], 2) if row["combination_effectiveness"] else 0
                })
            response_result = {
                "treatment_analysis": treatment_result_list,
                "duration_cost": duration_data,
                "side_effects": side_effects_data,
                "combination_therapy": combination_list,
                "status": "success"
            }
            return JsonResponse(response_result, safe=False)
        except Exception as e:
            return JsonResponse({"status": "error", "message": str(e)})
class PatientSurvivalAnalysis(View):
    def get(self, request):
        try:
            survival_data_path = "hdfs://localhost:9000/cancer_data/survival_records.csv"
            df = spark.read.csv(survival_data_path, header=True, inferSchema=True)
            df = df.withColumn("survival_months", (datediff(col("last_followup_date"), col("diagnosis_date")) / 30).cast("int"))
            df.createOrReplaceTempView("survival_records")
            survival_rate_by_stage = spark.sql("SELECT cancer_type, stage, COUNT(*) as total_patients, SUM(CASE WHEN survival_status = '存活' THEN 1 ELSE 0 END) as alive_count, AVG(survival_months) as avg_survival_months FROM survival_records GROUP BY cancer_type, stage")
            stage_survival_stats = survival_rate_by_stage.collect()
            stage_survival_list = []
            for row in stage_survival_stats:
                survival_rate = (row["alive_count"] / row["total_patients"] * 100) if row["total_patients"] > 0 else 0
                stage_info = {
                    "cancer_type": row["cancer_type"],
                    "stage": row["stage"],
                    "total_patients": row["total_patients"],
                    "alive_count": row["alive_count"],
                    "survival_rate": round(survival_rate, 2),
                    "avg_survival_months": round(row["avg_survival_months"], 2) if row["avg_survival_months"] else 0
                }
                stage_survival_list.append(stage_info)
            survival_by_treatment = df.groupBy("cancer_type", "treatment_type").agg(count("*").alias("patient_count"), avg("survival_months").alias("avg_survival"), sum(when(col("survival_status") == "存活", 1).otherwise(0)).alias("alive_count"))
            treatment_survival_stats = survival_by_treatment.collect()
            treatment_survival_list = []
            for row in treatment_survival_stats:
                treatment_survival_rate = (row["alive_count"] / row["patient_count"] * 100) if row["patient_count"] > 0 else 0
                treatment_survival_list.append({
                    "cancer_type": row["cancer_type"],
                    "treatment_type": row["treatment_type"],
                    "patient_count": row["patient_count"],
                    "avg_survival_months": round(row["avg_survival"], 2) if row["avg_survival"] else 0,
                    "survival_rate": round(treatment_survival_rate, 2)
                })
            age_group_survival = spark.sql("SELECT cancer_type, CASE WHEN age < 40 THEN '40岁以下' WHEN age >= 40 AND age < 60 THEN '40-60岁' ELSE '60岁以上' END as age_group, COUNT(*) as group_count, AVG(survival_months) as avg_survival, SUM(CASE WHEN survival_status = '存活' THEN 1 ELSE 0 END) as alive_in_group FROM survival_records GROUP BY cancer_type, age_group")
            age_survival_stats = age_group_survival.collect()
            age_survival_data = {}
            for row in age_survival_stats:
                cancer_type = row["cancer_type"]
                if cancer_type not in age_survival_data:
                    age_survival_data[cancer_type] = []
                age_survival_rate = (row["alive_in_group"] / row["group_count"] * 100) if row["group_count"] > 0 else 0
                age_survival_data[cancer_type].append({
                    "age_group": row["age_group"],
                    "patient_count": row["group_count"],
                    "avg_survival_months": round(row["avg_survival"], 2) if row["avg_survival"] else 0,
                    "survival_rate": round(age_survival_rate, 2)
                })
            five_year_survival = spark.sql("SELECT cancer_type, stage, COUNT(*) as total, SUM(CASE WHEN survival_months >= 60 THEN 1 ELSE 0 END) as five_year_survivors FROM survival_records GROUP BY cancer_type, stage")
            five_year_stats = five_year_survival.collect()
            five_year_data = []
            for row in five_year_stats:
                five_year_rate = (row["five_year_survivors"] / row["total"] * 100) if row["total"] > 0 else 0
                five_year_data.append({
                    "cancer_type": row["cancer_type"],
                    "stage": row["stage"],
                    "total_patients": row["total"],
                    "five_year_survivors": row["five_year_survivors"],
                    "five_year_survival_rate": round(five_year_rate, 2)
                })
            response_result = {
                "stage_survival": stage_survival_list,
                "treatment_survival": treatment_survival_list,
                "age_group_survival": age_survival_data,
                "five_year_survival": five_year_data,
                "status": "success"
            }
            return JsonResponse(response_result, safe=False)
        except Exception as e:
            return JsonResponse({"status": "error", "message": str(e)})
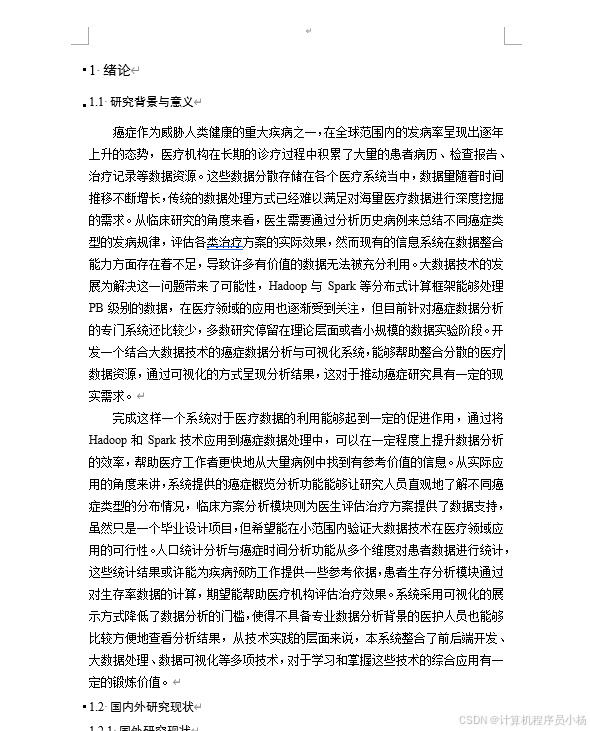
六.系统文档展示
结束
💕💕文末获取源码联系 计算机程序员小杨

汇聚全球AI编程工具,助力开发者即刻编程。
更多推荐



 4
4 0
0- 0


 已为社区贡献4条内容

所有评论(0)